
It seems like forever since the 2018 Census was held; thanks to the myriad of issues encountered when an unusually large proportion of people failed to complete it, we have been waiting a long time for any semi-useful information.
As you may recall, the 2018 Census was notable for asking not only about people’s means of travel to work but also for the first time about their travel for education (e.g. school, university) as well. We’re still waiting on the full release of travel data (some was out the other day), but a news agency was able to get some preliminary data for the six main centres on work commuting patterns. I was able to get hold of this underlying data to compare with previous years.
Now, the first challenge: we’re not really comparing apples with apples as Statistics NZ in their wisdom changed the question from “how did you travel to work on Census Day?” (2013 and before) to “how do you usually travel to work?” (2018) – this is a subtle shift that changes from people reporting about what they actually did to what they say they do. Needless to say, many people have viewed the change in Census question as a bad idea, especially for continuity of time series, but we have to live with it.

It’s particularly problematic for those who mix and match travel options (e.g. drive 3 days a week, bike 2 days – therefore they should all say they “usually drive”?). When looking at the smaller travel modes, it’s difficult to say how it might affect the reported change in numbers either positively or negatively. The reported issues with Census non-completion may also have some unintended consequences too (e.g. are there systematic biases in the travel modes of those less likely to have completed a Census form?).
In the case of the new travel to education question, we don’t have any earlier Census question to compare against, so that’s not an issue and it’s great that they’re finally asking about this important travel pattern too.
There’s another little fish-hook where asking about the “main means of travel” ignores the fact that many people use multiple modes to get to their destination, e.g. bike to train station, take train, then walk from station to work – which to pick? This is more likely to undercount short-distance modes like walk/cycle over longer distances ones like drive/public trpt. It’s an ongoing issue though, and one that is better addressed by the MoT’s Household Travel Survey data, which picks up every leg of a trip.
One more thing is that, to get a more accurate estimate of travel mode proportions, you need to ignore the people who didn’t travel (i.e. worked/studied at home or were sick or on leave). For example, apparently 9% of Chch’s working population from the latest Census usually work at home (again, this probably undercounts, e.g. I work at home once a fortnight so it’s not my “usual”). The new question does at least hopefully solve the problem of other people who were sick, etc as they can still state what they usually do.
So, with all those caveats in mind, here are some observations from the data:
- Collectively we have almost 20,000 people in Christchurch usually biking to work or study on a typical day, or nearly 40,000 bike trips. That overlooks the likely proportion of people who might also make these trips by bike less frequently, and of course the numerous trips by bike for other purposes e.g. shopping, meetings, recreation, etc (you might have seen the ChchCC Annual Residents Survey data that has consistently indicated that ~50% of Chch residents have biked on-road at some point in the past year, and about 1/3 in a typical month). The MoT Household Travel Survey data (albeit from a smaller sample) has historically estimated that Chch has about 50,000 bike trips a day on average, which might be higher now with recent growth but also seems to roughly tally with what the Census is telling us.
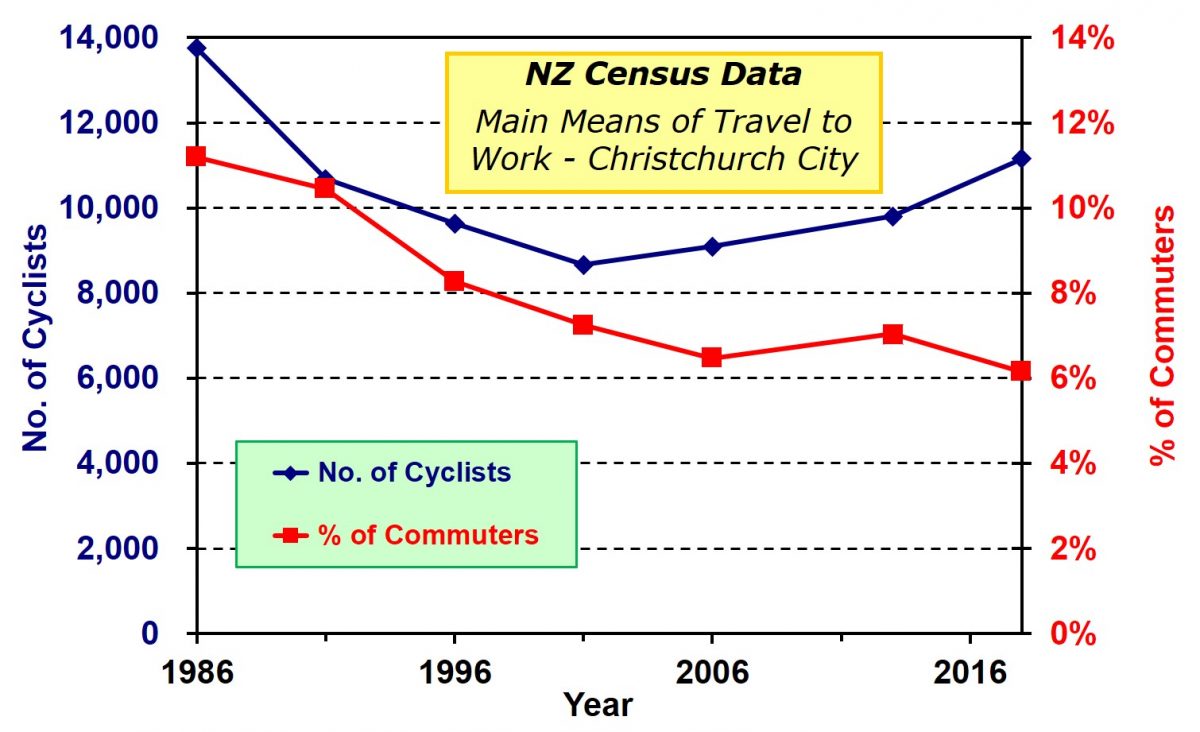
- Cycle trips to work in Christchurch appear to have grown by about 14% since 2013 (11,160 vs 9804), notwithstanding the above issues the data. However, the working population in Chch appears to have grown slightly faster over that time (15%) and private car trips to work in particular have grown a lot more (+38%); bus use has also jumped in numbers by 61% (although that just seems to be a case of returning to pre-quake levels). So the net effect appears to be that the proportion of trips made by bike has reduced from 7.0% of trips to work in 2013 to 6.2% in 2018. Again, I’d place some caution in those figures, due to the above caveats about comparing the two Census datasets, but it’s a little disappointing to not be climbing.

- Overall the top proportions of trips to work in Chch by the various travel modes are: Private car 67.7% (64.1% in 2013), Company car 12.4% (14.3%), Biking 6.2% (7.0%), Bus 4.6% (3.7%), Walk/jog 4.3% (4.6%), Car passenger 3.5% (3.9%).
- For comparison, the next best cycling city of the major centres is Wellington City (4.4% of work trips), with the rest below 3% (Auckland is 1.1%). I haven’t got their figures yet, but I gather that Nelson continues to lead the way nationally (Chch was second to them last time). Again, there have been some impressive growth stats in actual trip numbers (e.g. Akld up 29% since 2013, Wgtn up 31%) but that is battling against even greater growth in travel to work by driving. Only Wellington seems to have held its own against the general tide of growth in other trips to work.
- When it comes to people who travelled for study (i.e. did not study at home), about 9.4% usually biked in Chch (8385 people), about the same as those who bused, about half that of those who drove or walked, and about ¼ of those who were driven. Only Tauranga City seems to have a very similar proportion biking to study; Hamilton is at 5.5% and the rest are below 3%.
It will be interesting to see the Census figures broken down by suburb when that is available; last time there were about 20 suburbs in Christchurch with >10% bike commuting to work, with Beckenham tops at >16%. It will also be interesting to see if there is any correlation between growth in numbers biking to work/study and construction of nearby Major Cycle Routes…
What do you think of the Census results?
“it’s a little disappointing to not be climbing” – it’s exactly what I expected to see due to the change in question. My perception is that cycling has increased, by quite some, since the last census. But I also feel that there are a lot of people out there who sometimes cycle, and on other days they use other modes of transport.
The new question is a little odd. Let’s pretend 100% of commuters cycle two days a week, and drive a car three days a week. The result of the census would be to show that 100% of all commuters drive, whereas in reality, 40% of all commuting trips would be by bike. That being said, the census might have also been a little early to capture the MCR boom. Numbers really started to go up in the last year or so, I think based on my tracking of the 365-day averages.
Yeah possibly, although it’s interesting that in my preliminary monitoring of the data the overall growth citywide seemed to peak for the 12-mth period ending May 2018 and then fall back a bit (starting to climb again now). I need to re-check my indexing analysis and see if everything is being weighted appropriately, then I might publish something.
Here is one comparison:
Difference between 365-day rolling average on 31/5/2018 and 18/12/2019
Marshland Rd, -11.2%
Main North Rd, -22.0%
#DIV/0!
Rutland Reserve, 12.0%
St Asaph St, -3.2%
Railway Cwy, -4.9%
Papanui Rd, -14.6%
Colombo St (North), 4.6%
Yaldhurst Rd, -14.4%
Heaton St, -23.0%
Hagley Park (North), 3.1%
Worcester St, 30.1%
Buckley Rd, 1.6%
Antigua Bridge, -11.0%
Hagley Park (South), -6.7%
#DIV/0!
University Dr, 21.7%
#DIV/0!
Little River Trail, -11.9%
Lincoln Rd, -12.5%
#DIV/0!
Colombo St (South), -4.5%
#DIV/0!
Cashmere St, -10.9%
Difference between 365-day rolling average on 30/6/2019 and 18/12/2019
Marshland Rd, -1.7%
Main North Rd, -4.2%
Travis Rd, 59.9%
Rutland Reserve, 4.6%
St Asaph St, 8.4%
Railway Cwy, 1.7%
Papanui Rd, 3.0%
Colombo St (North), 2.7%
Yaldhurst Rd, -0.3%
Heaton St, -6.9%
Hagley Park (North), 5.2%
Worcester St, 12.5%
Buckley Rd, -3.8%
Antigua Bridge, 5.8%
Hagley Park (South), 7.5%
Antigua St, 2.3%
University Dr, 7.3%
Linwood Ave, -0.1%
Little River Trail, 1.6%
Lincoln Rd, -0.8%
Collins St, 6.3%
Colombo St (South), 0.5%
Spark St, 22.7%
Cashmere St, -0.9%
I should add that I called a “365-day rolling average” but the way the formula works is that where the counter existed for less than 365 days for the date the rolling average is calculated, the average will be the average of however far back the numbers go. That’s for example the reason why there is a drop for the Eco counter. The “365-day average” on the 31/5/2018 was really the average from 17/5/2018 to 31/5/2018.
Thank you Jan for some interesting numbers.
Many of us were concerned that Council’s focus on the MCR’s and neglect for the connecting local cycle network required to keep the “interested but concerned” or “8-80” cyclists engaged would end up discouraging cycling.
Having been enticed into cycling with the promise of infrastructure they would find themselves part way through their journey dumped onto an unsafe street. It only takes a few close calls to inspire fear.
This may explain the numbers.
PX 10 – I am currently spending the Xmas break mapping, riding , and describing 25 routes around the city that are safe and enjoyable for those ‘interested but concerned ‘ for the St Albans bike group. ( ages 50 to 80 ) Whilst including the major cycle routes as the default framework the challenge has been to ‘link ‘ them together using other quiet streets, at the same time avoiding intersections where the perceived risk of conflict is high for those less confident. Yes, it only takes one bad experience to put anyone off.
The intersection I would really like to avoid is northbound Colombo St at Beasley, despite it being part of the Papanui Parallel. Sad treatment for cyclists there, has been right from the start imo.
The other frustration is discovering how many so-called cul-de-sacs are signed at No Exit streets. ( when there are alleyways to walk and bike through ). This should have been dealt with years ago. There are some nifty ‘ complementary ‘ routes already available yet little is done to accurately sign and promote as a useful alternative to unfriendly corridors. In the big world of MCR funding it seems like the nimble, cheap and quick wins are taking the cinderella category.
So, right when there has been a major government investment in urban cycleways nationwide, as well ever increasing pressure on our transport networks and climate change really hitting home, StatsNZ decides to throw away a highly valuable historical time series in favour of a vaguer, less accurate question. Nice work.
The difference between 6.2% and 7.0% mode share is 1,440 people. For this difference to be solely due to the change in wording to the census question, the number of people in Christchurch who usually drive to work but biked to work on census day, would need to be at least 1,440. Do you think that’s likely?
In 2018, over 144,000 people in Chch said they usually drive a car/van/truck to work. So that is only 1% of this number that need to sometimes ride a bike instead; certainly possible.
The CCC surveys indicate 23% of Christchurch residents (~100,000) cycled on-road at least once a week (http://cyclingchristchurch.co.nz/2018/07/01/support-and-usage-of-cycling-still-high-in-chch/). It does seems entirely feasible that 1,440 of those might have biked to work on census day but not been counted because it’s not their usual mode of travel. If anything this result suggests we should expect the real number to be significantly higher than 1,440.
So if we accept that, is it reasonable to conclude that this census data does not show cycle mode share decreasing? If anything it shows it is most likely growing, although we won’t know for sure till next census.