
Anytime that cycleways are discussed around Christchurch, it doesn’t take long before someone pipes up and claims that they never see any (or many) people using the new or previous cycleways. I always wonder just when, where and how they are looking because, from my perspective, I continue to see a steady stream of people biking around the city. As I’ve also pointed out before, there is also often an optical illusion between what you see and how many people are actually riding during a typical day.
A philosophical debate with people about different opinions of cycling usage isn’t much help though if you’re just coming from differences of perception. What’s more useful is actual counts of cycling numbers from various locations around the city. While people like our friend Robert can do manual surveys at various places, I don’t imagine that he wants to stand somewhere 24 hrs a day, 7 days a week, to collect data over a complete time period. That’s where automated cycle counts come into play.
There are two main ways that cycle numbers are automatically captured in Christchurch:
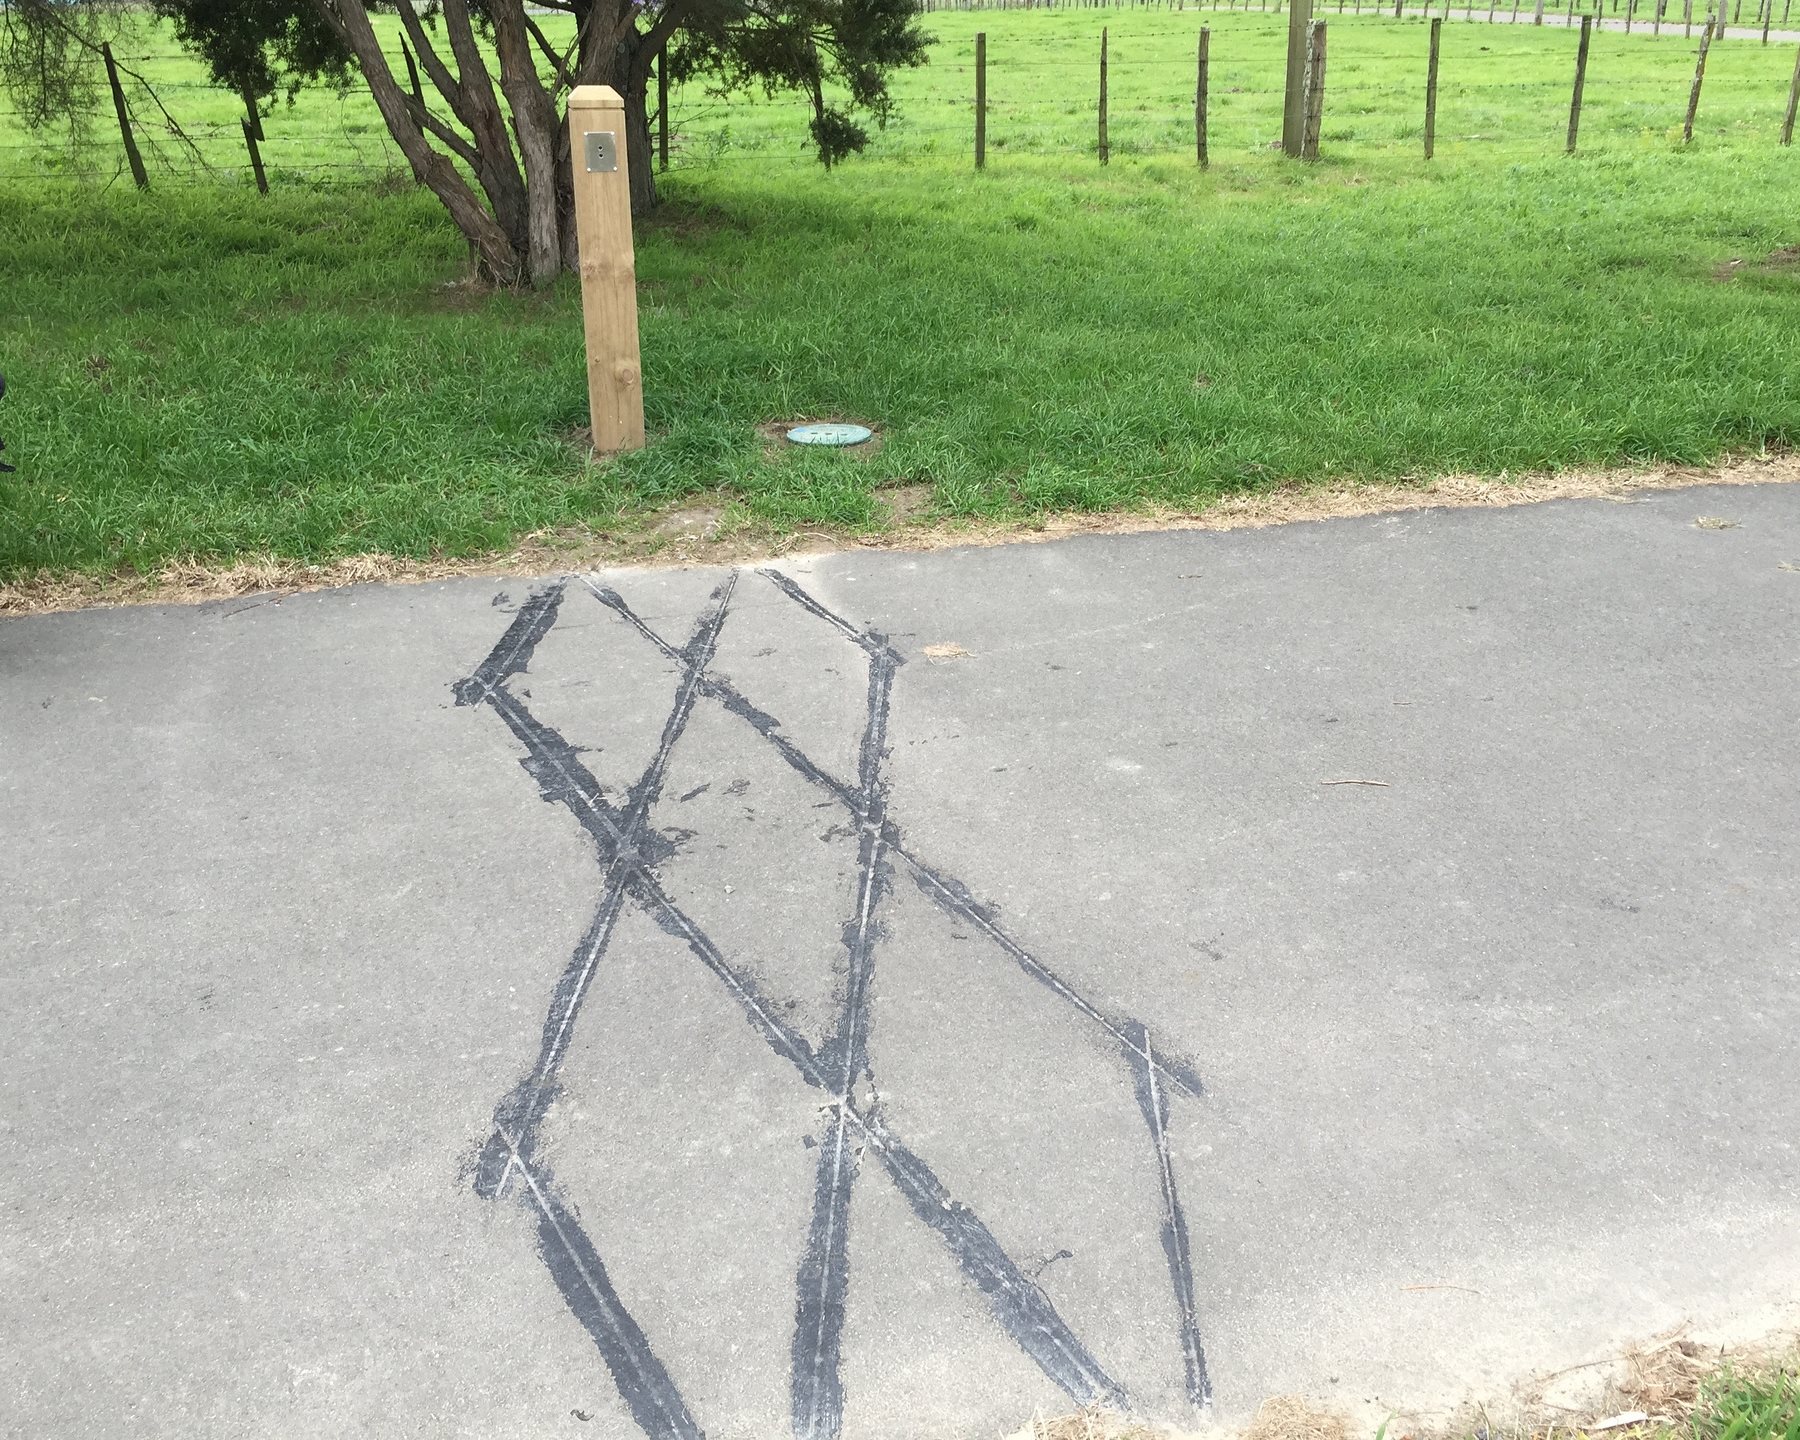
- Permanent inductive loops are installed on cycleways, either as the detector for an approach to signals, or just as a standalone counter. Essentially these act as metal detectors, picking up the signal created by a bicycle passing over them (generally they can be smart enough to distinguish the “signature” of a bike from other metal objects passing over them too). You might see them as a set of rectangles cut into the cycleway surface, where inductive wires are laid. More recent ones used on the new cycleways often feature a diamond pattern instead.
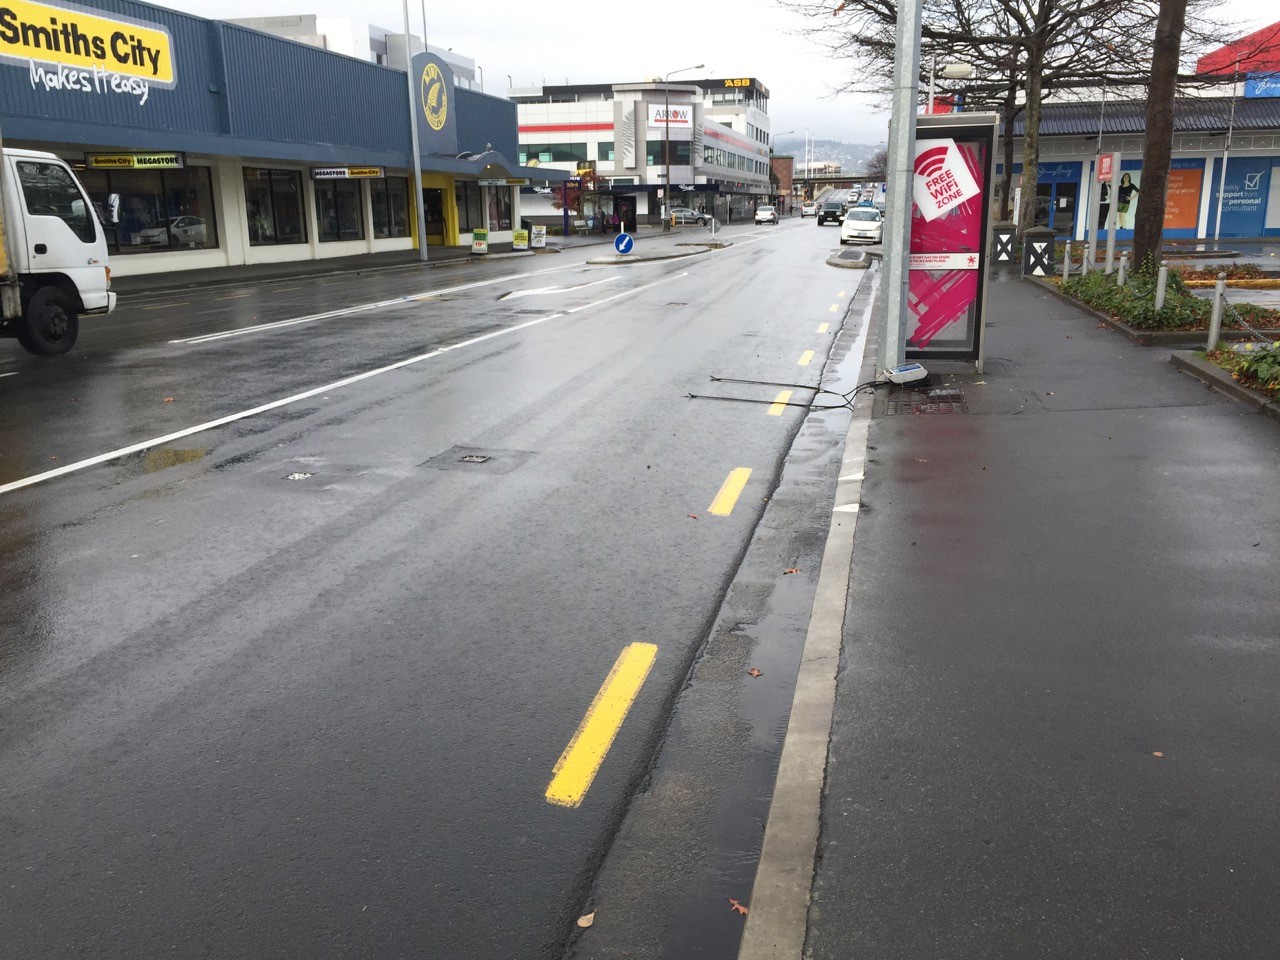
- Other sites may be temporarily counted every year or so using a set of soft rubber tubes across the cycle route. The weight of the bike creates an air pulse that is registered; two tubes enable the presence and speed of bikes to be identified (and differentiated from anything else that passes over the tubes). You may have seen these tubes out and about recently on many streets; unfortunately some people prefer to avoid riding over them (especially if the tubes are a bit short). Moral of the story: if you want cycling to count, you need to ride over the detectors!
OK, so having collected this data, when can we see it? Apart from those of us who know a Council staffer or two who could pass on some data, getting up-to-date cycle counts for Christchurch has been rather tricky. Some traffic count data (including bikes) is available on the CCC website, but it’s a bit clunky and varies as to its currency.
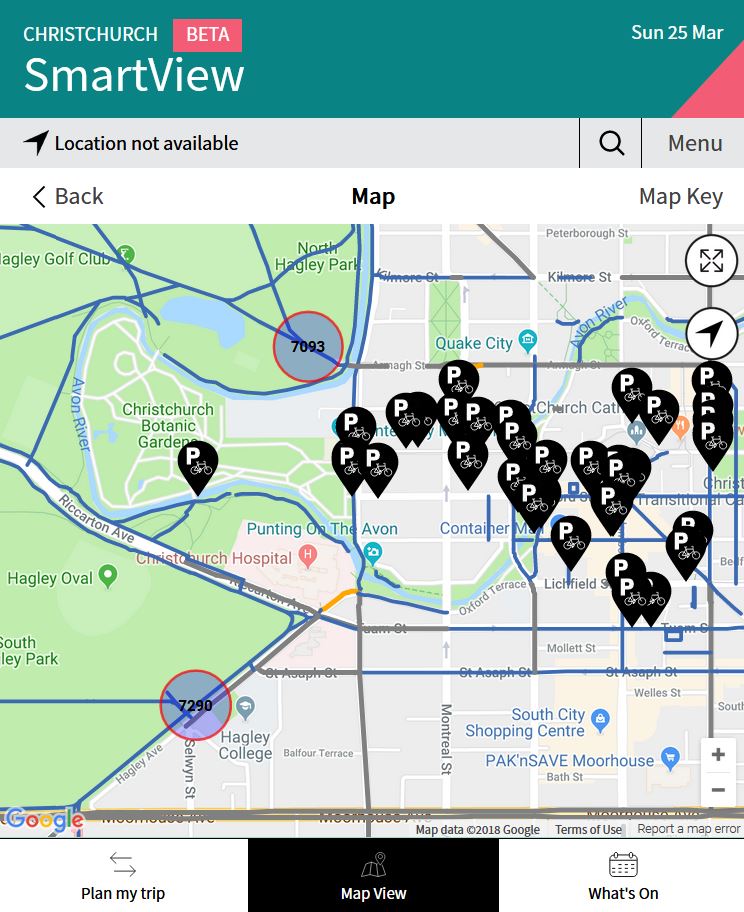
Fortunately now there’s an easier way to see cycle counts around the city, using CCC’s new SmartView website (hoping this will be made into an app some time too). Amongst the many layers of information in this very useful tool, is information about the average weekly bike counts at key count sites (not entirely sure why they show weekly counts rather than just average daily counts, which would be easier to comprehend). So now we can see for example that both the Uni-Cycle through North Hagley Park and the Little River Link in South Hagley Park saw over 7000 riders in the last week (or >1000 per day). For anyone who wants to use the data for their own application, there’s even a live feed.
Maybe in due course, we might also see a live “totem pole” display along one of the cycleways, so that everyone can see immediately how many people are riding there. But at least for now you have a resource that you can point to when someone says “no-one ever cycles in Christchurch”…
Have you used the new SmartView site yet?
Totem pole… watch this space 😉
You are right Sara. The ‘totem pole’ is coming! It has arrived in Christchurch and will be situated on a popular Christchurch major cycle route within the next month. If you want to know what the ‘totem pole’ will be like, check out this article https://www.stuff.co.nz/auckland/81900693/prime-minister-john-key-geared-up-on-aucklands-quay-st-cycleway
I shared this info with workmates the other day, but at that stage there was a note on the website saying the numbers are combined pedestrian and cycling, and they hadn’t separated the figures.
That note is now gone, but the numbers are similar to what they were.
do you know anything about this?
There’s a cool heatmap function on smartview too, I assume taken from Strava’s dataset
Most of the count sites aren’t counting peds (eg Hagley Park) so I couldn’t quite figure out what that was about. Loops and tubes on the ground won’t pick up pedestrians. There are some overhead (microwave?) detectors that pick up both, but usually they’re smart enough to also tell them apart.
Good spotting Wayne. When the Smart Cities team (the creators of SmartView Christchurch) displayed the data, we discovered we were showing a combined count of pedestrians and cycles. Our developer quickly sorted that out with our CCC cycling planners and the data provider and the numbers showing on SmartView are now cyclists only. We posted that message up briefly until we had accurate data.
Your assumption is that the heat map is Strava data is also correct. The interesting thing about that data is that there is an extremely strong correlation between Strava user patterns and non-Strava cycling patterns.
Please keep on using SmartView and let us know any comments, suggestions, issues, compliments via the Feedback tile.
For instance, if you or your friends are bus users, there’s a pretty cool live bus tracker feature under development. 🙂 Check out https://smartview.ccc.govt.nz/#map/layer/bus-routes;real-bus-position.
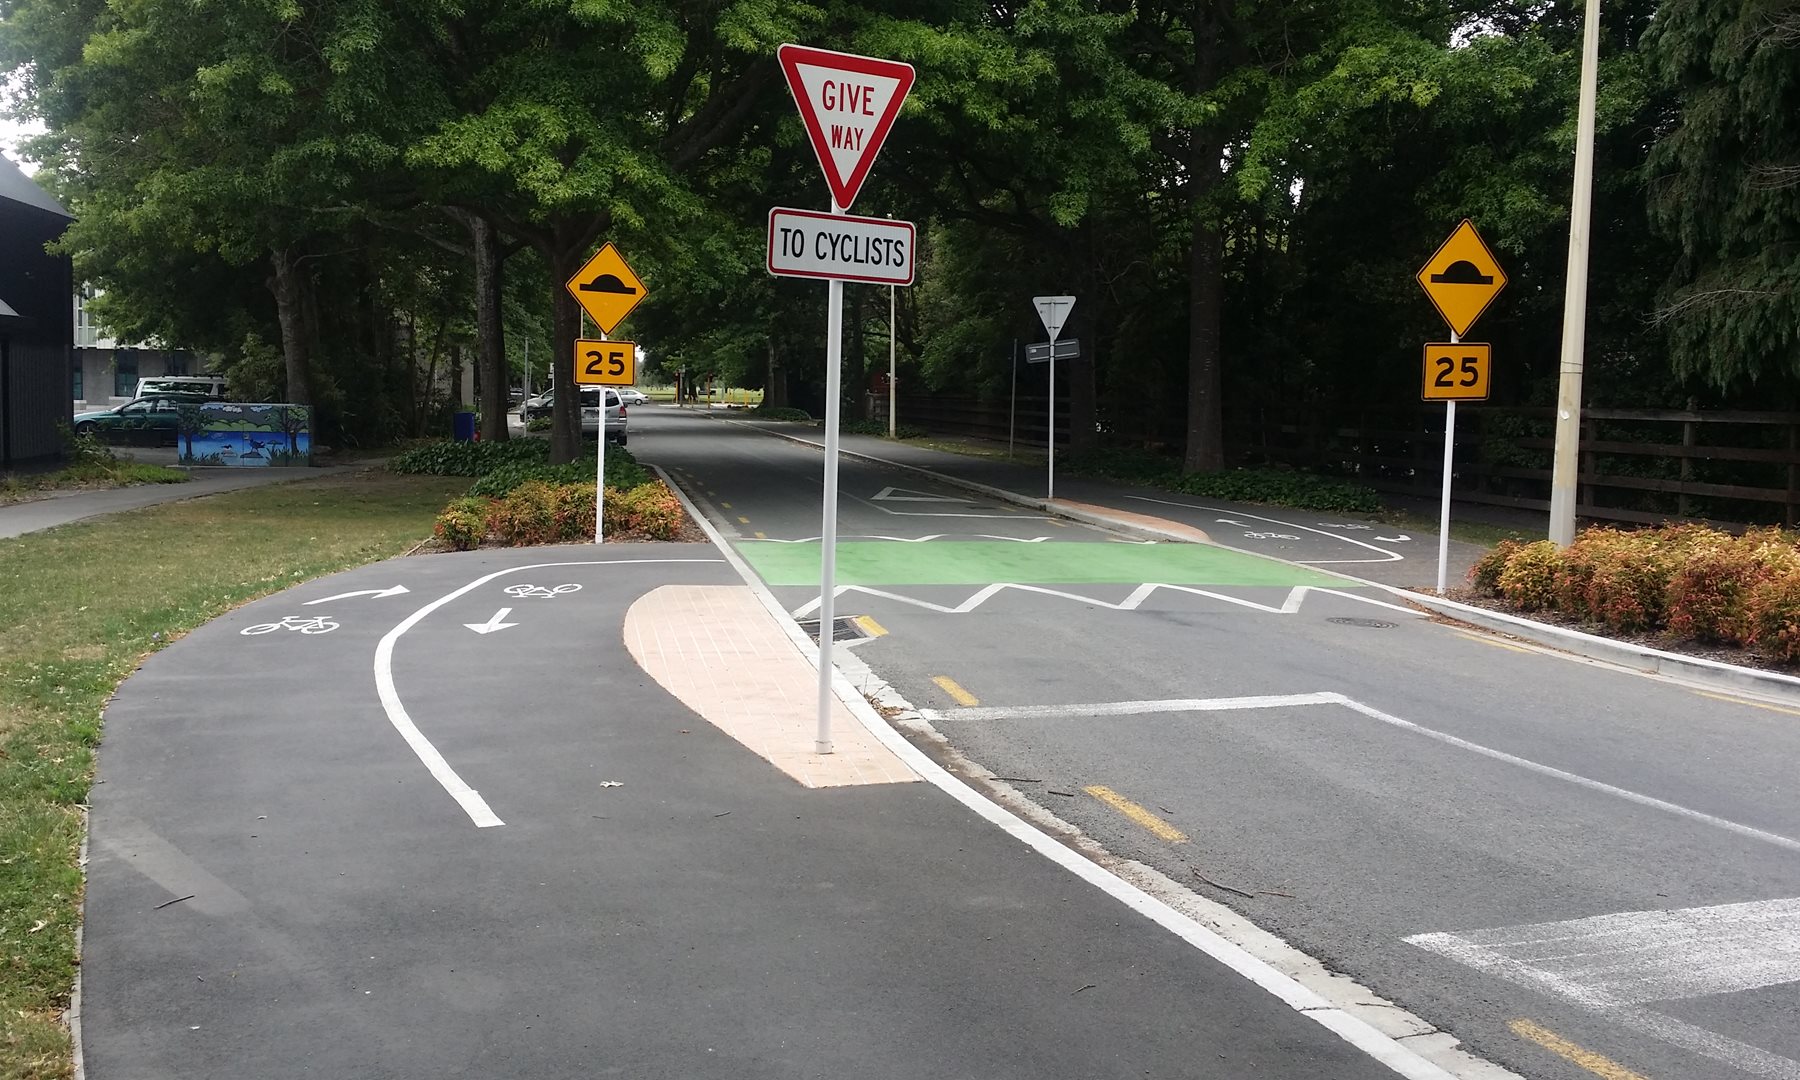
The caption on the first photo that reads “ See, no-one ever uses these cycle ways” could also be “See, no-one ever used these roads”. No cars.
Thanks for a great article Lennyboy. Very informative and I appreciate you sharing the link to SmartView Christchurch. I’m the Programme Manager for the Smart Cities team at Christchurch City Council. Some of our programme’s priorities are:
* to gather and visualise real-time data
* use this data and its insights to make a better city for people and visitors
* to improve wayfinding and access to transport options by putting accessible, real-time information in people’s pockets (hence http://www.smartview.ccc.govt.nz)
Watch this space because another cycling related initiative on the way from the Smart Cities team will be the launch of Fabriko’s Sensibel. This nifty little button is attached to your handlebars and allows you to record positive and negative experiences of your ride!
Hmm….. looking as if I can hang up the original bike count clip board then. Can view the city results in comfort now. Mixed thoughts with that
The comparison is often made between cars and bikes. Seems to me that between bikes and peds might be more revealing – I see vey few, if any peds on Lincoln/Halswell Rds between say Annex and Henderson’s at rush hour, but plenty of cyclists. Time to stop building footpaths? I think not!
I’m going to be a killjoy here.
I don’t agree with the fact that cycleways are taking over some of the busiest car driven roads throughout Christchurch.
These counters and totem poles can’t cater for the fact that an individual rides over or past them on multiple occasions in a day (to and from work, homeless people who ride around aimlessly etc).
I have to apologize, because I don’t think the number of cyclists, particularly in Christchurch, is enough to dramatically change the lanes you have already been given. Especially in the areas being changed.
Why not put build them in cashmere, or down more roads adjacent to schools? Where cycles are used over 100% more than everywhere else combined.
And if cyclists are fighting for the same right as motor vehicles, why aren’t there compulsory number plates for every cycle? I don’t personally see it fair that a car or truck has road rules to follow, but if a cyclist breaks a road rule or weaves in an out of traffic, or causes an accident, it’s down to, “oh a guy with a black shirt or blue pants is running red lights.”
Don’t see this as a hate message, for the record. See it as somebody with a different perspective.
Thanks for your different perspective Matt; as a researcher it is always helpful to have a sceptical view on any data. I certainly agree that we could do with more counters around the city to help expand the picture of who’s cycling where (e.g. there are no counters along my route to work) although the Strava heatmap also on SmartView is a useful proxy in the meantime. As further Major Cycleways get built we will certainly see more counters on these routes at least.
It’s not really relevant that a person might ride past the same counter more than once a day; the same also applies to motor vehicle trips and no-one complains about that; it’s still a trip that needs to be catered for. We’ve always been clear that this data is recording the number of TRIPS, not people; again, like driving, it is likely that some people get counted at multiple locations across the city. Fortunately, we have other data sources that can tell us how many people might be cycling, e.g. the 10,000/day riding to work from the Census (fortunately the most recent Census will also tell us how many are cycling to study). We also have data on the number of residents who cycle at some stage – a higher proportion than many people realise: http://cyclingchristchurch.co.nz/2017/03/06/mythbusting-hardly-anyone-cycles/
The number plate request is also a red herring because a Police office can still stop a cyclist they observe doing something wrong (this is how most motor vehicle offences are captured too). Given that over 10,000 bicycle infringements are handed out each year in NZ, evidently that is already happening (yep, plenty go unpunished, but that is no different to the countless infringements we all see drivers make as well without consequence). Various investigations elsewhere of bicycle/cyclist registration schemes have invariably found that they would cost more than they recoup in fines or other benefits; indeed, they are likely to put some people off cycling.