It’s been a little over a year since I last had a good look at how cycling numbers have been tracking across the many cycle counters in Chch. At that time the picture was a bit murky, thanks to a couple of years of disruptions from Covid lockdowns, worker illnesses, working from home, and the like. But there was also a gem of hope that the trends were starting to sneak back up again…
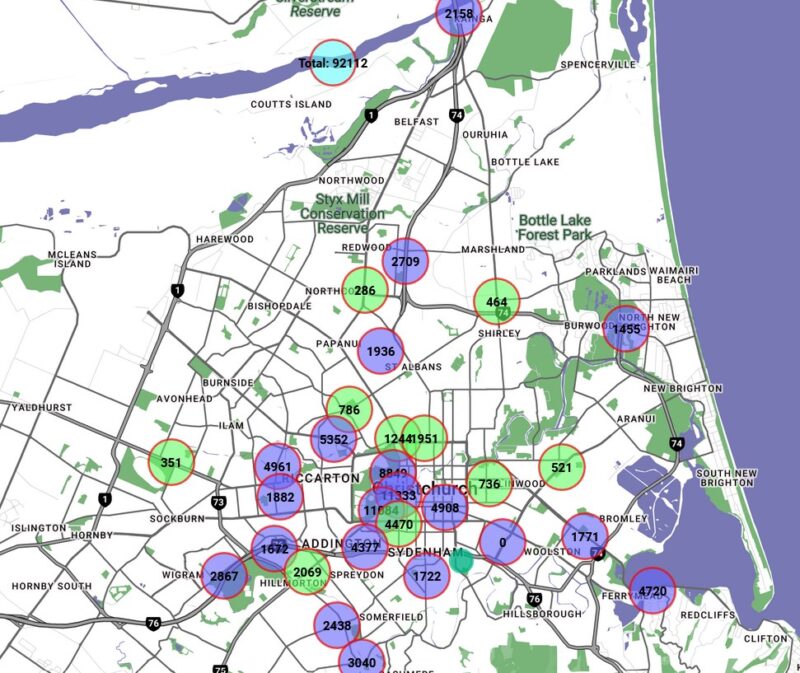
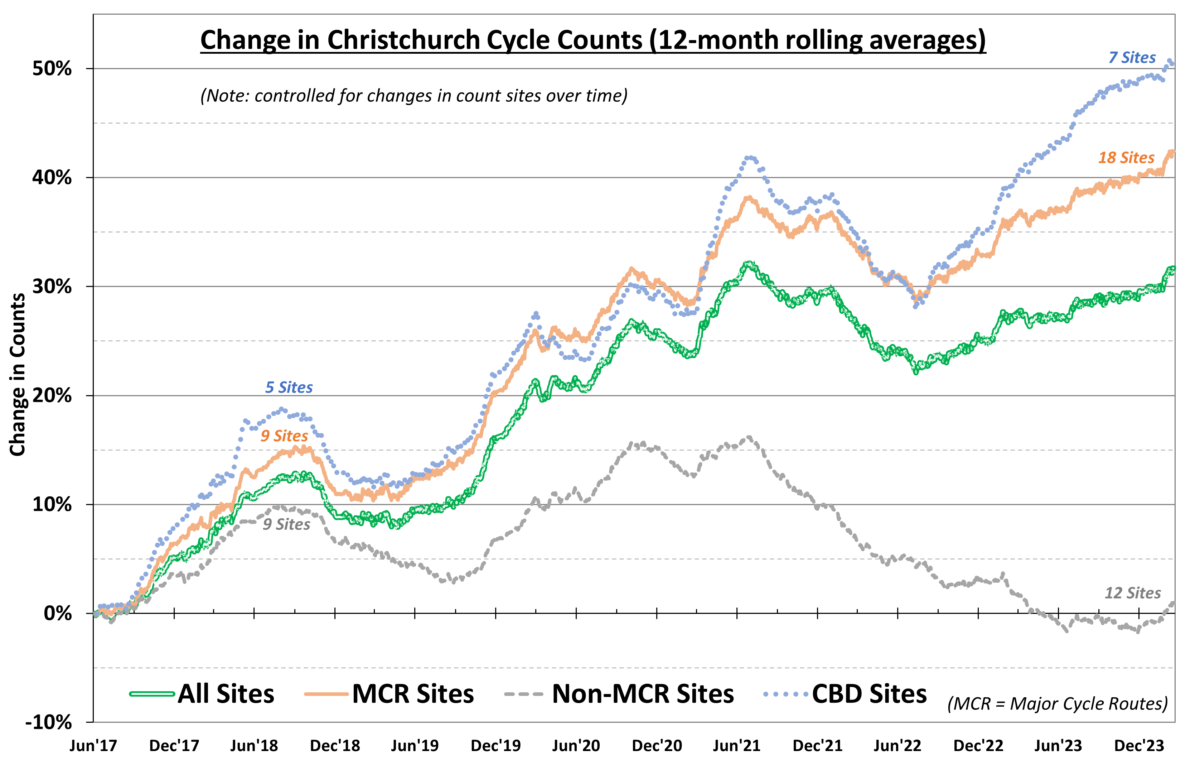
14 months later, I did an analysis last weekend of what the latest cycle counter data was telling us. As you may recall, this involves downloading the various data sets from Chch City Council’s various automatic cycle counters around the city (30 of them now) and monitoring the changes over time in the rolling 12-month average. There are a few annoying data glitches where some counters are out of action for a period of time (NB: any time the number of counters monitored changes up or down, I hold steady the calculated growth across the city). But, even taking that out of the equation, the picture has been incredibly good lately…
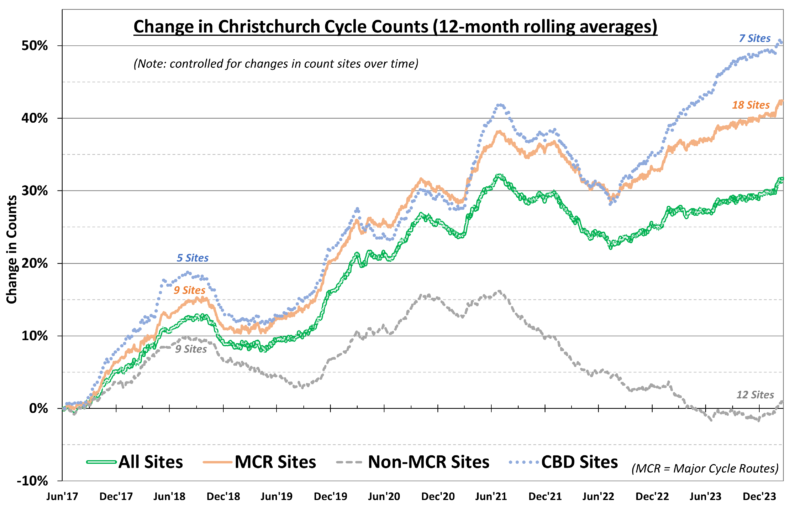
As you can see, since the first cycle counters started recording in 2016-17, there has been more than a 30% increase in cycling overall across all the counters. This has been particularly evident along the Major Cycle Routes where the increase is more than 40%. And for the counter sites within or on the edge of the central city, the growth is over 50% – quite impressive jumps. And it’s not just a case of riders switching from other routes to the new cycleways, as the non-MCR count sites are showing virtually no change in numbers now from 6-7 years ago.
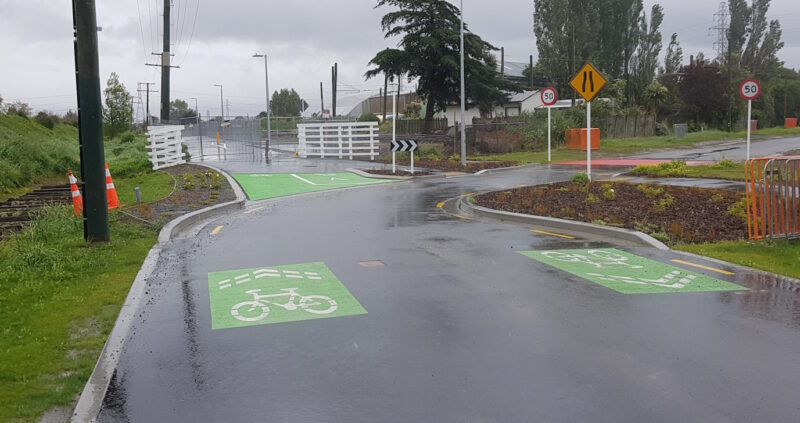
What’s particularly noticeable too is how the truism of “build it and they will come” has really applied to some of the locations with the greatest growth in numbers in the past year. When comparing average count numbers between Feb 2023 and Feb 2024, some of the highest increases at counter sites have been:
- Charles St, Woolston (+39%) – along the recently completed Heathcote Expressway route
- Peverel St, Riccarton (+27%) – along the recently extended South Express route
- Linwood Ave Path (+26%) – along the recently linked Rapanui / Shag Rock route (and now connecting further via the Coastal Pathway)
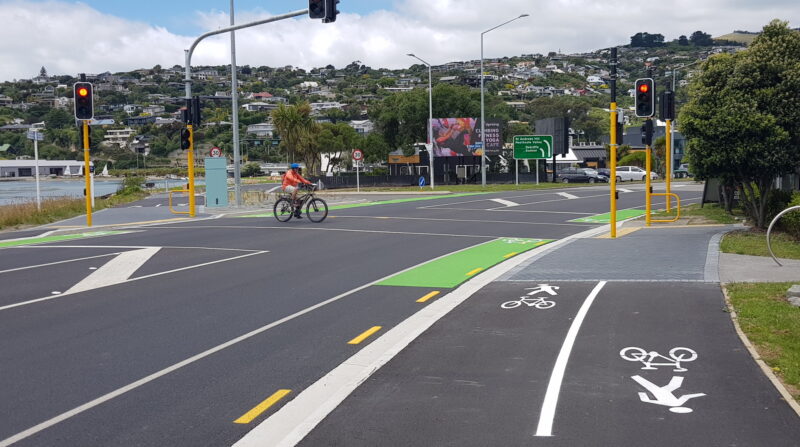
So that’s all good news, and what’s really noticeable is how there has been a consistent rate of growth over the past 18 months or so. Let’s hope that continues as the balance of our major cycling network is completed…
Have you noticed the growth in cycling numbers lately?

At this Humphreys Drive intersection the automated lights switching on approach to favour cyclists is lovely, but beware of red-light runners!
I’m now catious of all mid-block dedcated bike signals, such as Lincoln Rd & Sparks Rd, both on the Norwest Arc, I suspect drivers just don’t process that they should stop rather than anything intentionally malicious, I’ve had some apallingly close calls. Yet there are others like the one across Barrington St that seem to be fine, that is right on a T intersection tho’s so does that alter things in the mind of an inattentive driver?
I have anecdotally noticed a lot more fellow users of the Quarrymans Trail in the past 6 months. Whether it is the cost of living and energy (petrol) biting or more connectedness of the various cycelways who knows.
To amuse myself on my daily 5 km commute to the CBD I count cyclists. 15 years ago it averaged about 6 and, on wet days, it was just me and the guy with the red-faded-to-pink backpack (you know who you are!!). I guess he’s retired or moved as I don’t see him anymore. Nowadays it averages around 20 per day and around 6 in crappy weather. Old school cycling counting! My highest count ever was 32 but it rarely dips below 16. If I go a longer route that uses the quarry man’s trail and past the boatshed bridge and Hagley Park its up 1n the 70s. Bring on more cycle infrastructure, it really does work- that and concern about climate change, congestion and car parking hassles in the CBD, possibly the will to get healthier and save money… and as people realise that it’s really not that hard to cycle!
Is there anywhere we can find the number of non-recreation kilometres cycled per year in Christchurch? Then we can work out how many extra kilometres are being cycled following the investment in the cycle network. Even the total number of kilometres would be helpful.
It would be interesting to know if there is a description definition for what a recreational cyclist is, vs a non-recreational cyclist. For instance there are a proliferation of groups of people riding around the city on most days of the week. What category for them ? Are they riding recreationally or using bikes as a means of transport to get from A to B, where B is a cafe for a social get together. Is a group of like minded people meeting up socially who individually drive to a cafe, or meeting venue, driving recreationally, or for transport ? Difficult to distinguish as well. Somehow it feels as though money spent on safer cycle infrastructure for those who bike is unnecessary, because many perceive cycling as purely recreational and therefore the cost to make it safer and enjoyable is ‘wasteful spending’.
Alice, the Ministry of Transport undertakes an ongoing Household Travel Survey that estimates the amount of travel made by different modes, and split by urban areas, demographics, trip purpose, etc (in answer to the recreational or otherwise question, only about 30% of bike trips are recreational; most are people getting from A to B). Here’s the link; expanding the Notes section will give you a bunch of spreadsheets with more data: https://www.transport.govt.nz/statistics-and-insights/household-travel/