

It’s time again to have a look at the cycle counts around Christchurch to see what’s been happening to cycling numbers lately. You will recall that we first did this exercise at the start of 2021, and then a year later at the start of 2022. What started as a pretty encouraging pattern of good growth in cycling numbers since 2016-17 has been somewhat muddied by the dramatic effects of Covid in the past few years. So what’s the trend now?
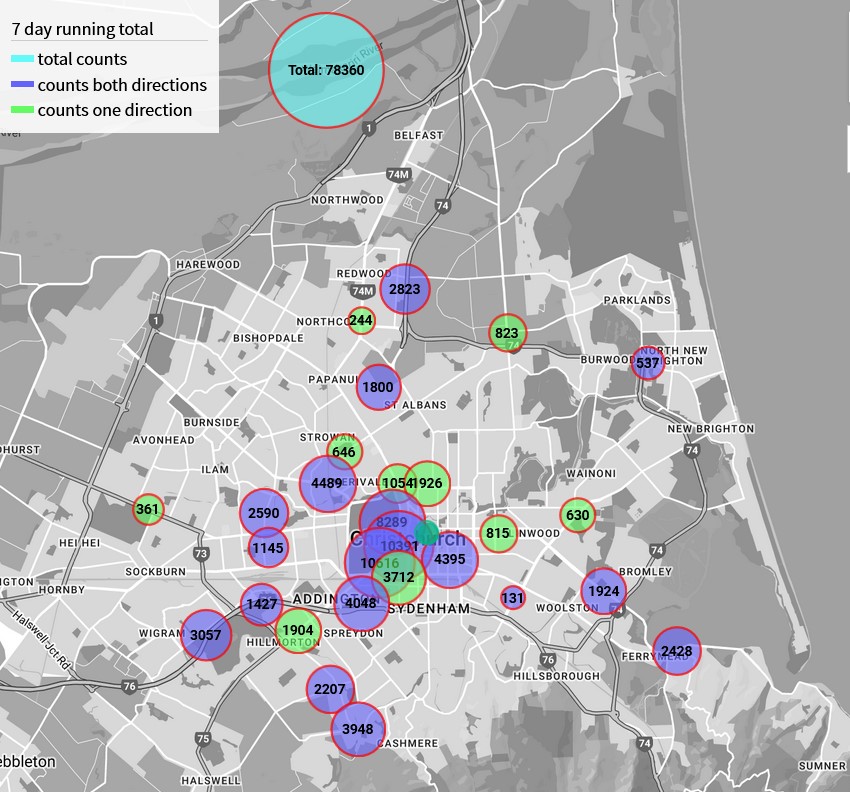
First a quick reminder of how this analysis works: the city has up to 30 different continuous cycle counters on cycleways and streets (although sometimes one or two are out of action). The data from these are fed to the wonderful CCC SmartView website where you can see the latest counts and also download data right back to the start of each site.
So this data is aggregated and monitored over time by me for the average change (remembering that these sites still miss a lot of cycling out there), with a couple of controls on the data:
- A rolling annual average of the past year’s daily counts is plotted to avoid any variations simply due to changes in seasons and weather – any point in time always reflects the previous 12 months’ data
- The relative change in total counts is monitored day to day to produce a continuous “index” of change, but any time a site is added (or removed), the index is held steady to avoid distorting the change
So when all of that is done, what is the data telling us about the amount of cycling? Well it’s complicated… (even The Press struggled with it in an analysis half a year ago)
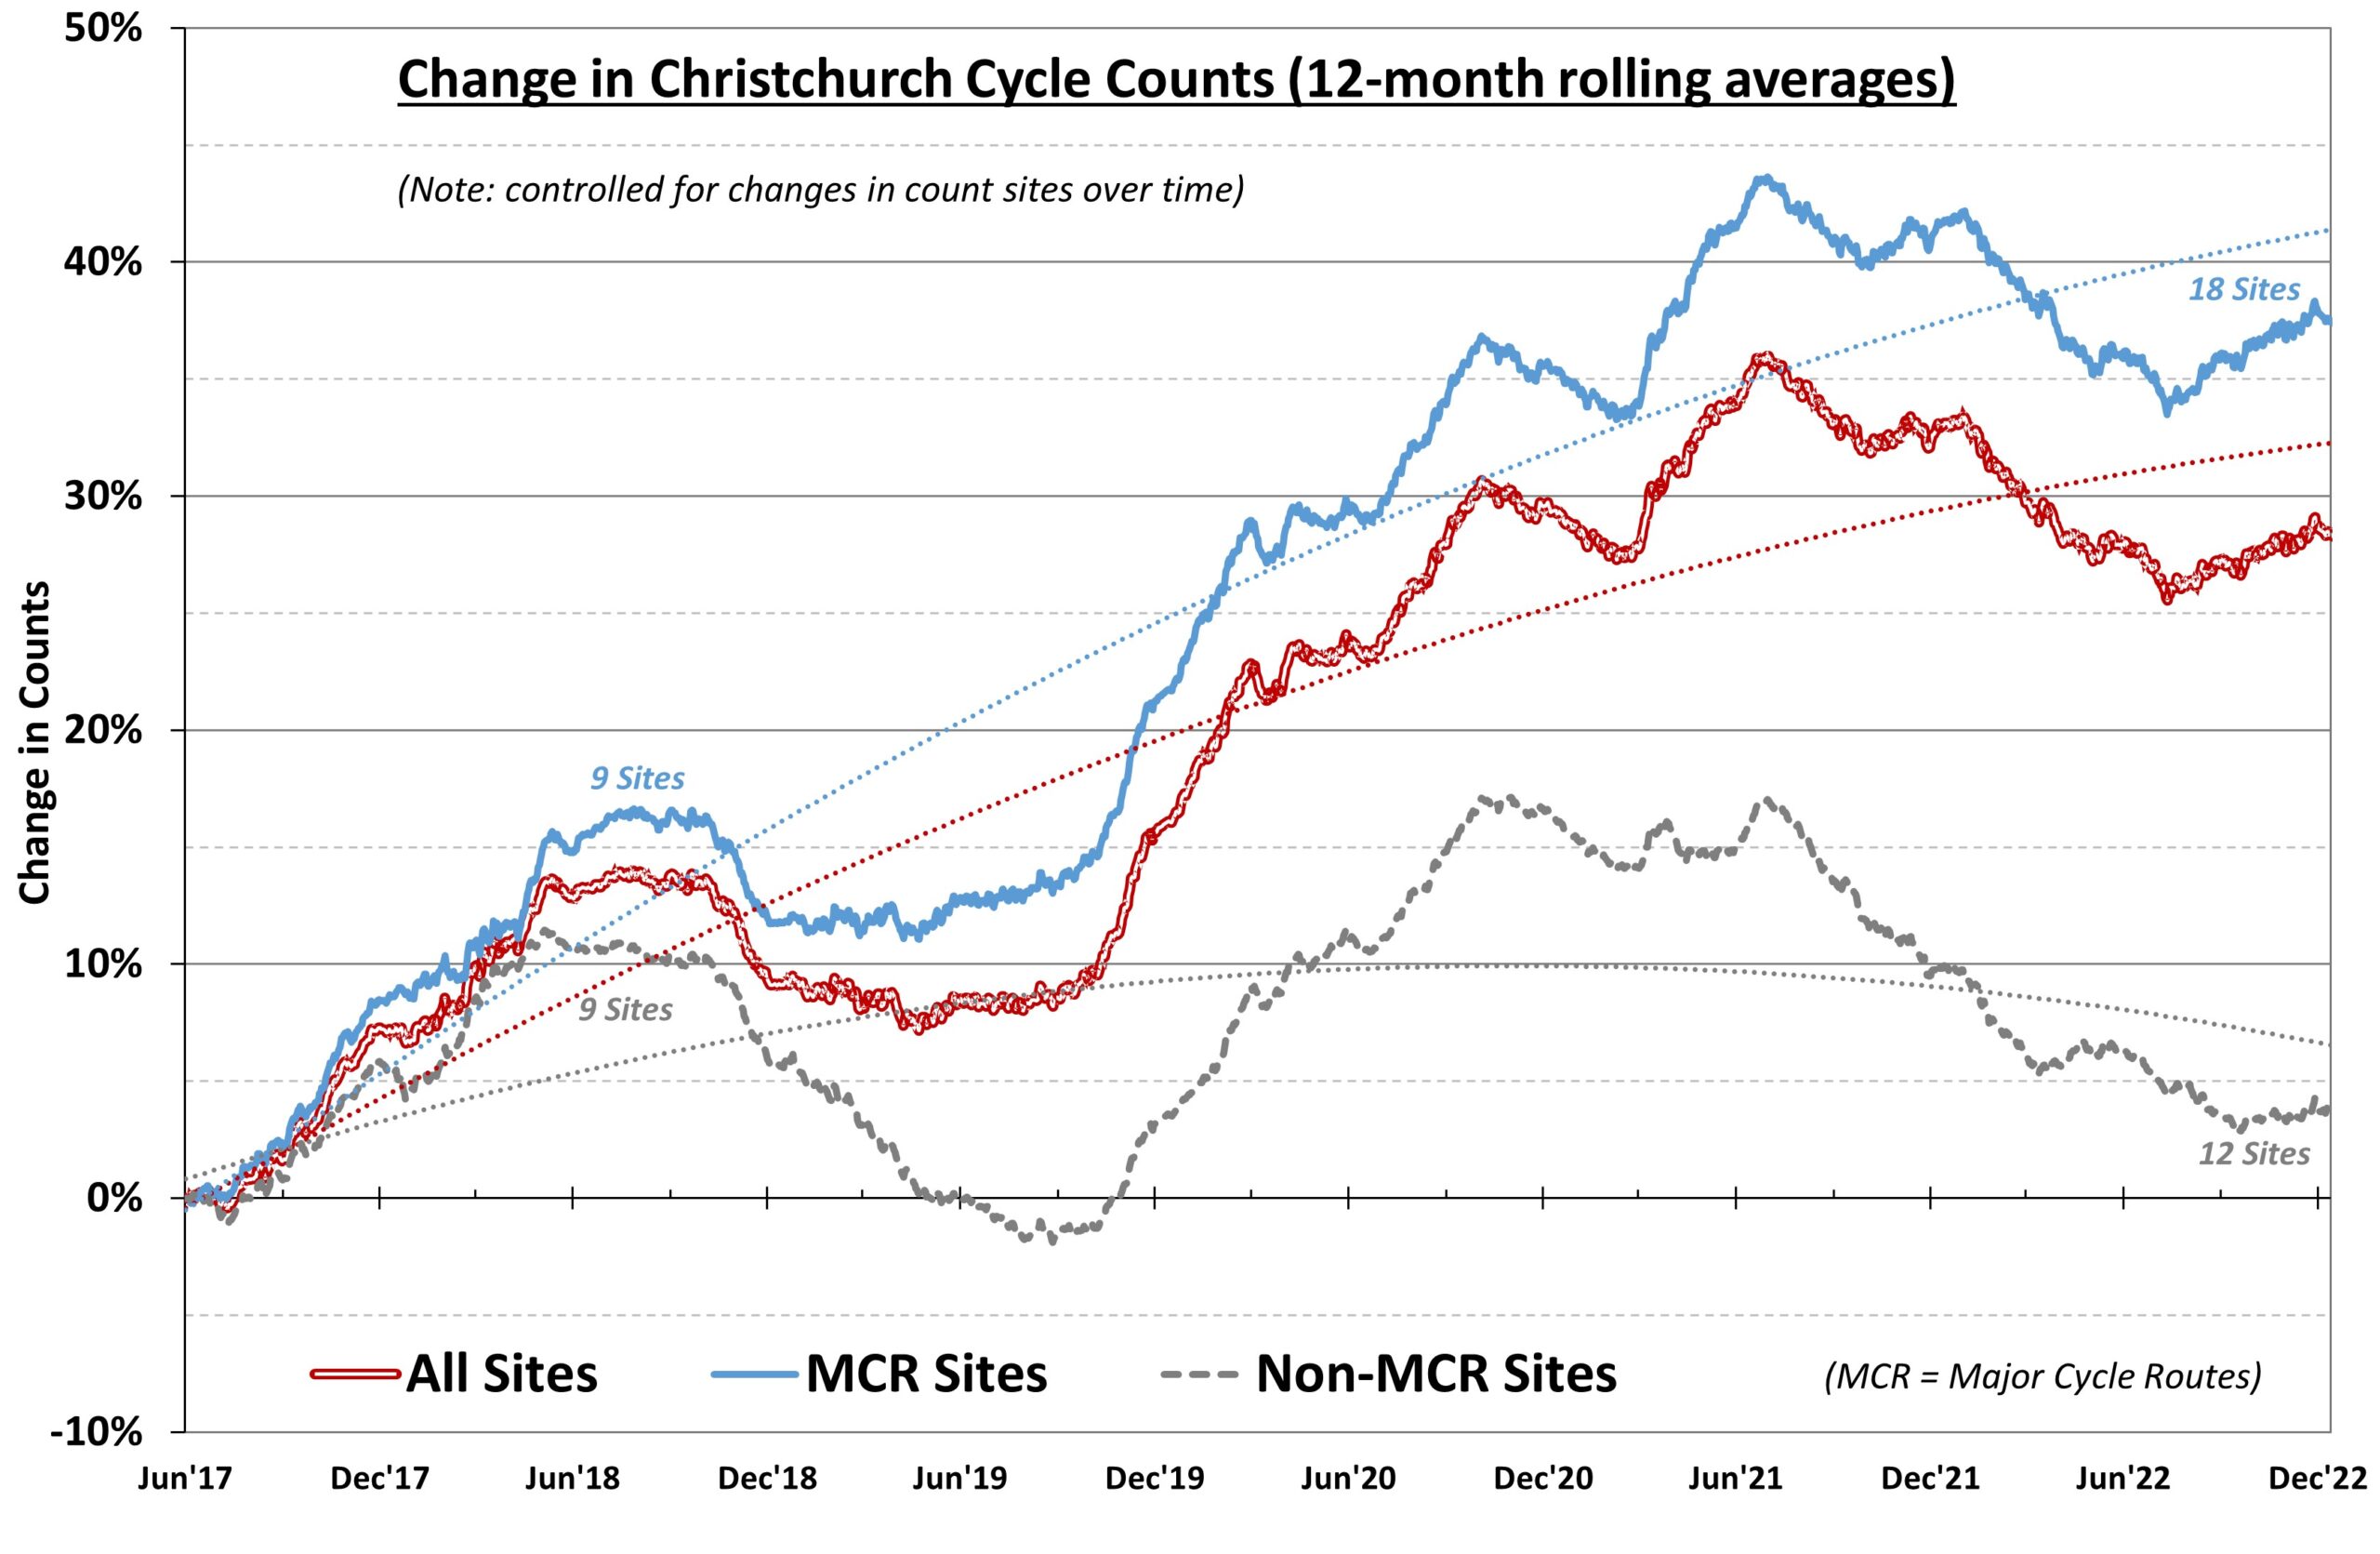
As you can see, compared with the average counts back in 2016-17, while the current cycling numbers are still ~30% higher than five-odd years ago they have dropped a little from the peaks of about 12-18 months ago (remembering that these numbers are always reflecting the average of sites over the 12 months prior).
Of real interest is how the counters not on the MCR routes (generally on parallel on-road cycle lanes) have dropped quite a lot lately (compared with the 18 sites on the MCRs where growth is nearly 40%). This suggests that there has been a reasonable shift of people switching to the nearby Major Cycle Routes (although these sites are still holding their own compared to their numbers in 2016/17).
Is the overall trend surprising? Well, not really when you consider the weird landscape we’ve had in the past few years:
- Full-on lockdowns leading to staying at home (although interestingly there was often a corresponding nudge in cycling in the suburbs during these times).
- Covid “traffic-light” restrictions that have often meant in practice a continuing norm of working or studying from home more often than before.
- A steady stream of people in the past year or so sick with Covid (roughly 40% of the population) and still ongoing, plus influenza and other bugs going around.

It’s perhaps not surprising that some of the biggest drops we’ve seen in the past year have occurred near places of study, including the Uni-Cycle at Ilam campus (down 16%) and Travis Rd next to the new joint high-school precinct (down 13%) – if they’re not sick anyway, many students are electing to stay home to do their study remotely.
Of course, it’s not just cycling that has seen this effect on previous numbers. Motor vehicle counts also took a hit over the past couple of years, falling by at least 10% on average in 2020 (when the initial lockdowns happened), and bus patronage has dropped by about 25% since 2019. So, in comparison to these changes, cycling still isn’t doing too badly…
It’s not all bad news, as we’re seeing some good growth where some of the newer cycleways are rolling out. For example, with the South Express cycleway being completed through Riccarton and Sockburn, the Peverel St counter in Upper Riccarton has seen numbers more than double over the past year. Another notable increase over that time is the 22% gain at the St Asaph St counter near Ara, which has no doubt benefited from the work to complete the final connection into town along Ferry Rd.
I’m encouraged too by the apparent uptick in average cycling numbers over the past six months. As some sense of “normality” is returning with the lifting of any Covid restrictions, people do appear to be getting back out there and taking advantage of the growing cycleway network on offer. Let’s hope it continues in the coming years…
What do you think of the current cycle counts?