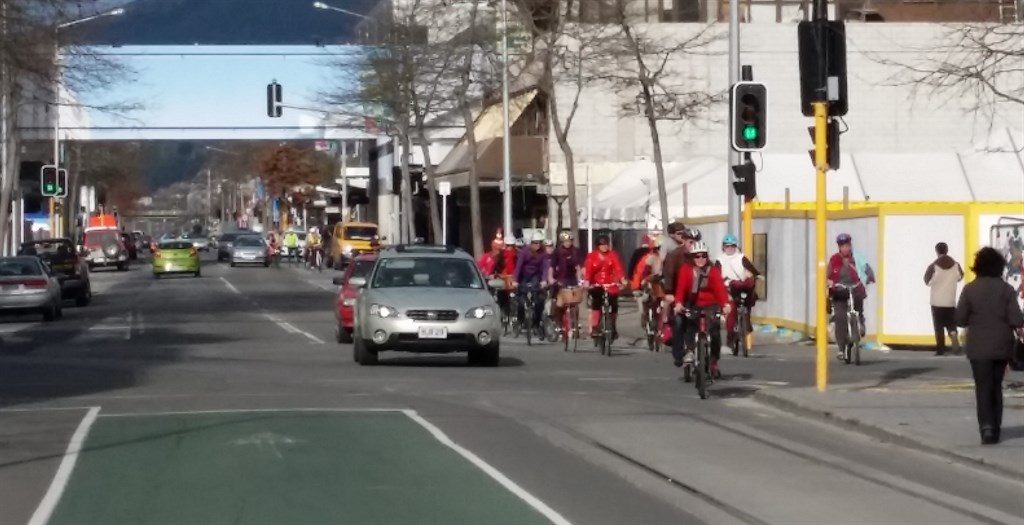
Christchurch City Council have recently posted about how the various cycle counters around the city have seen further good growth in cycle trips over the past couple of years – great results from the investment in new cycleways. Perhaps not surprisingly, the social media naysayers have been out in force on Facebook claiming that it’s fake data or doesn’t match what the latest Census tells us (spoiler alert: the data is fine…). There seems to be a certain scepticism by many that, because they hardly see (or know) anyone who cycles, therefore very few people do it. Fortunately, we have other data sources like the Census, MoT Household Travel Survey, and CCC Annual Residents’ survey to triangulate the actual numbers. This post, originally from Mar 2017, outlines how we use these sources to understand who’s biking…

Getting cycleways over the line in Christchurch (and the rest of New Zealand) has always been a difficult task, with various concerns about cost, car-parking, traffic restrictions, potential conflicts, you name it. It’s interesting to note though how often we still see someone complain that they don’t see the point because they “never” see any cyclists or that it’s only a very tiny proportion of people who cycle. So why are we “pandering to a small minority”?
The short answer is that such complainants are wrong, both in terms of their own observations and the actual usage data available. Indeed, any time I hear someone say that they never see any/many cyclists, I think it says more about the person looking (or not looking…) – perhaps they should do the test to illustrate the “attentional blindness” that seems to occur?
There are two separate questions to consider:
- How much cycling is done in Christchurch city?
- How many people in Christchurch cycle?
While there is site-specific count data for cycling around the city, and once every five years we also get Census data on who’s commuting by bike, the best indicator for total Christchurch cycling usage comes from the Ministry of Transport’s Household Travel Survey. This is an ongoing survey whereby a sample of people (about 5000 households across NZ) maintain a travel diary of their activities for a few days and this data is then scaled up to the national population. It gets a bit tricky to get a precise estimate of travel patterns in smaller areas (the sample size starts to get too small) but, for larger urban areas like Christchurch, a reasonable picture is formed from combining 2-3 years worth of trip data and this data is available online.
The sample size means there’s a bit of variation, but what it generally indicates is that in the past few years there has been an average of about 50,000 cycle trips a day in Christchurch, about 1/5 of all cycling in the NZ. Note that by “trip” we mean one journey from an origin to a particular destination; a bike ride to the shops and then back home counts as two “trips”. On some particularly busy stretches of our cycle network, we’re already seeing over 1000 riders per day too.

OK, that’s well and good. But if we assume that the average rider makes two trips a day (i.e. somewhere and back), then the above figures translate into about 25,000 people or maybe 7% of Christchurch’s population. That doesn’t seem like a lot of people we’re talking about. But people with this view are falling into the trap of assuming that “X% of trips equals only X% of people who cycle”. The flaw in this thinking is that every day it is not the same people who cycle on each day. For example, I ride to work most days, but there may be the occasional days when I either work at home or am travelling out of town. Conversely there are people who don’t regularly ride to work, but perhaps occasionally go on a recreational bike ride in the weekend every now and then.
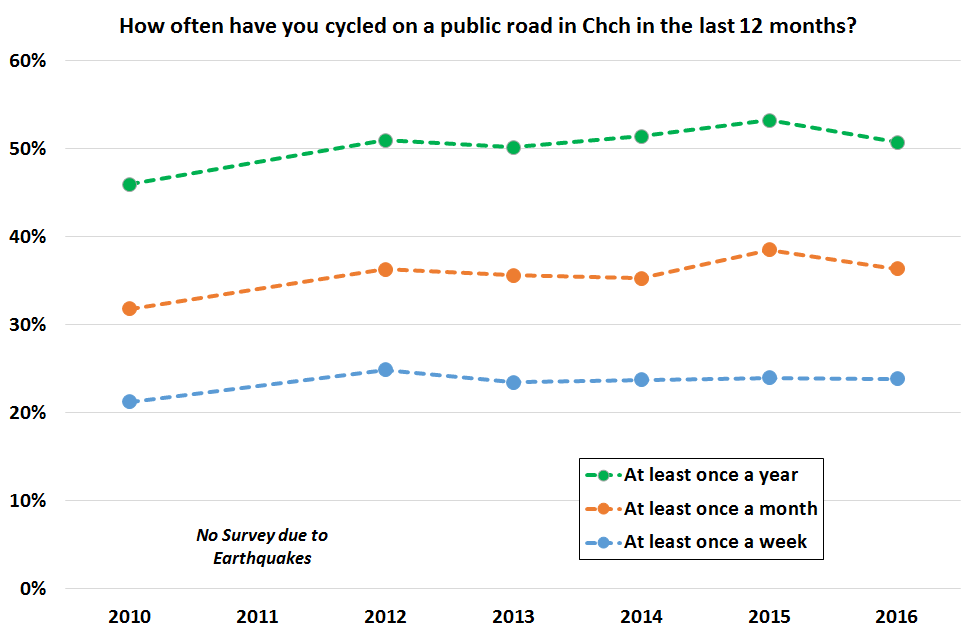
Again, we have some data to help us from the City Council’s own annual Residents’ Survey. Amongst the various questions is one that asks “how often have you cycled on a public road in Christchurch in the last 12 months?” (note: not including mountain-bike tracks). As a rough rule of thumb (see chart below), it basically works out that on average about 1/4 of residents have cycled in the past week, about 1/3 in the past month, and about 1/2 in the past year. 50% of the city having cycled in the past year? Suddenly not such a small minority…

These figures show that cycling in Christchurch is not just the hobby of a select few. Of course, the whole point of the Major Cycleways programme is not to cater for the existing cycle numbers but to encourage more people to bike regularly… Many of those 50% of residents may only cycle a few times a year but are keen to do more if the right environment is offered. Slowly we’re working on making that happen here…
How many people do you know who cycle? How many who don’t cycle?
