
The winter gloom can be a bit tough to enthuse yourself about getting out and enjoying some bike riding. And when it seems that there are commentators left, right and centre panning cycleways, one is entitled to feel a little picked on.
So it is comforting to see some recent data on cycling that isn’t just “the plural of anecdote”. Every year, the City Council commissions market research from a sample of its residents covering a wide range of topics to gauge where it is doing well and not so well. The latest results are now out; not surprisingly, hot topics like water quality and roading repairs have come to the fore. But what’s also very interesting are the questions relating to cycling.
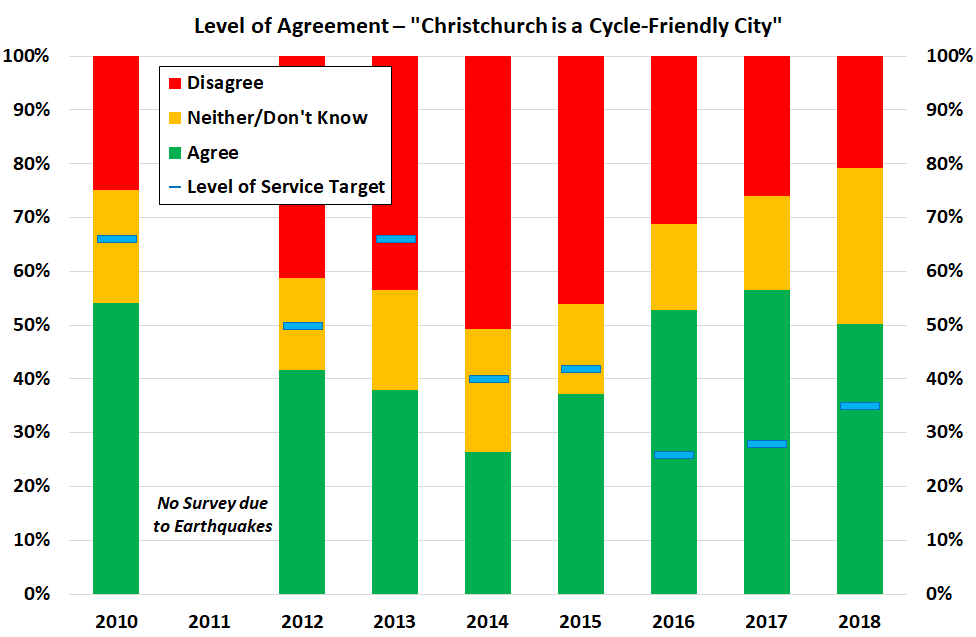
The first relevant question that the survey asks is whether people think that Christchurch is a cycle-friendly city. You can see from the graph above that support has been up in the past couple of years (mirroring when the bulk of the Major Cycleways have been constructed), with about half the population in agreement. The number of respondents who disagree continues to decline, but it is interesting that the unsure numbers have jumped up; perhaps a sign of the unrest about the cycleways programme that has been clamouring away in the background of late.
{Still a bit odd why the Council’s internal target %’s are so low…}
 The next question asks how much respondents have cycled in the past 12 months. The results continue to show that cycling is not just the domain of “a small minority” – in fact it is a slight majority. 51% of respondents have biked at least once in the past year, with about 35% cycling at least monthly and 23% cycling at least weekly. Remember, this is a representative sample from across the city’s residents, in terms of age, gender, income, etc.
 If those numbers seem at odds with the fact that only 2-3% of all trips in Christchurch are made by bike, you have to remember that most people are multi-modal – they mix and match travel options to suit their needs. A reasonable analogy might be the fact that probably only 2-3% of all retail purchases are gift-related (birthdays, Xmas, weddings, etc) rather than food, clothes and the like, but you would assume that quite a large proportion of people spend on gifts at some stage.
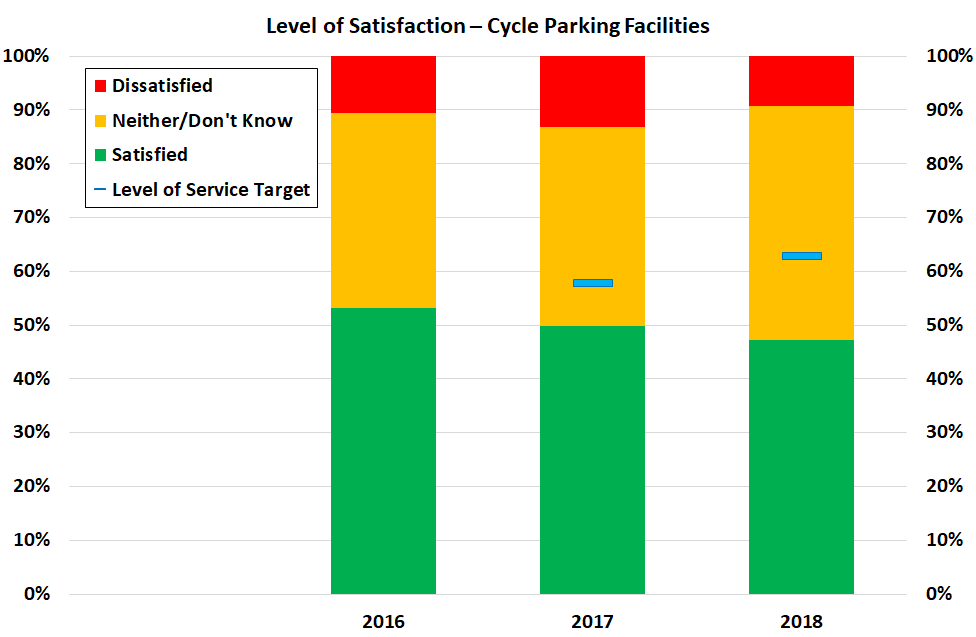
There is a third cycling metric that has been monitored by the Council since 2016; the level of satisfaction with bike parking facilities. The results haven’t changed too much in the first three years, with equal measures of satisfaction and indifference, and only about 10% dissatisfied. This could be a reflection of the recent growth in cycle numbers outstripping the rate of cycle parking being provided; we’ve certainly pointed out a lack of cycle parking around the city in the past. Hopefully as further bike parking rolls out, the satisfaction numbers will improve.
This year’s survey results continue to mirror the findings from previous years, so there’s a fair bit of comfort to be had in the robustness of the numbers. At a time when people’s “I reckons” often get a lot of airing (esp. via social media), it’s nice to know that objective data collection is still around to capture a more balanced picture of cycling.
What do you think of the Council’s Residents’ Survey results?
It’d be nice to see the percentages of people cycling regularly go up, rather than stay fairly stagnant.
On the basis of the 2nd graph, the cycleways over the past few years haven’t actually made a difference (which I don’t believe)
It does seem interesting that people’s satisfaction has gone up and down heaps, yet numbers of people cycling are really steady. Other count data has gone up, so I would’ve thought this would as well. A couple of thoughts on why:
1) the surveys exclude anyone under 18 which is a key part of the growth in people using the cycleways
2) it maybe suggests that growth on the cycleways is just people who were already biking shifting their routes
3) the categories are too coarse to capture some kinds of growth – e.g. people who previously biked once a week and now bike every day won’t be picked up by this question
4) the network is still very disconnected – most people can’t bike to their destinations without hitting a section that is incomplete and being required to bike on a busy road for part of their trip- so it still largely excludes anyone who doesn’t feel safe biking on busy roads (which is most people).
I suspect that it’s more a case of people cycling a bit more (and this may not be fully captured by the coarse frequency categories shown), so there are more trips out there but not necessarily a lot of new people. Some other data has suggested that about 15% of new riders in Chch have switched from driving, but it’s not clear whether they previously fell into the “never cycled” category or just “rarely cycled”.
Hiya. The LoS for Chch being a cycle-friendly city was changed as part of the LTP and is now just over 50%, with increasing targets over time.
S.
I cycle to work everyday. I might easily respond that Chch isn’t a cycle friendly city if I were thinking about the behaviour of some motorists rather than the lovely cycleways that take me 80% of my commute. I think the words “cycle friendly city” are extremely vague and it’s really hard to make any sensible interpretation of what the results to that statement means.
Have there been any surveys in Christchurch on the general level of support or otherwise for cycleways in the city, like Mike Hosking’s infamous non-opt-in “opt-in” survey in Auckland? It would be interesting to know if the opposition is just a vocal minority, like Auckland, or a widely held view.
I guess the Long Term Plan exercise just completed is essentially an “opt in” survey, which in this case showed support more than 2:1 for continuing the cycleways programme. I can’t think of any statistically representative survey that asks this question though. I guess the challenge is that typically you have a decent-sized middle group who are indifferent to cycleways (i.e. they’re not too fussed whether you build them or not), and you don’t tend to hear from them in any opt-in survey.