
“Build it and they will come” – that’s what we’re regularly told about the magic of induced demand, especially for something like transport. It certainly seems to happen when we build additional roading capacity – what about when we build decent cycleways?
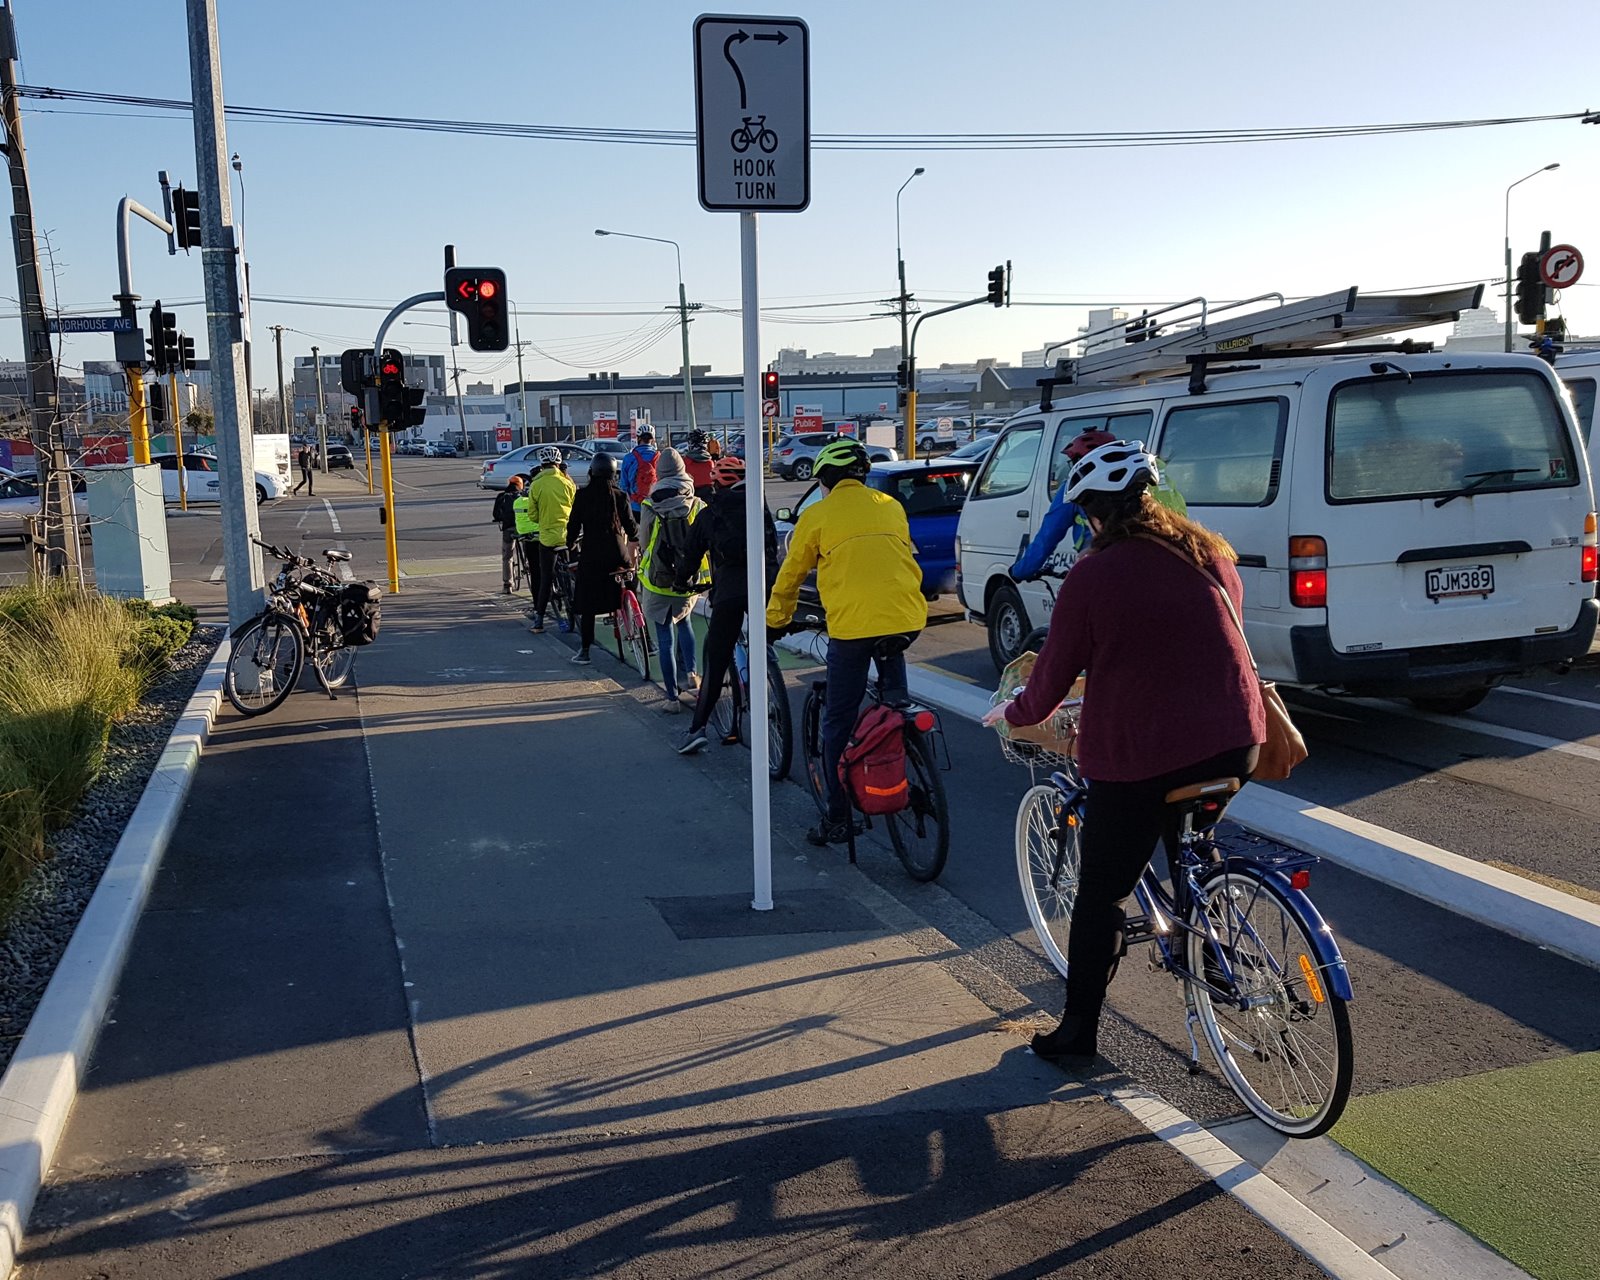
In Christchurch, we’ve been putting this to the test for the better part of ~seven years now, with a swathe of Major Cycle Routes and other cycle facilities being constructed in the post-quake rebuild. At various times, the work has come in for criticism for the amount of money being spent on it (never mind the $1.1 billion spent over the same period on motorways here…), the quality of the finished product, and whether it has made any difference at all to cycling numbers.
National data like the occasional Census and the ongoing Household Travel Surveys can provide some idea of changes in cycle numbers, but it’s a slow process to wait for the latest info. Fortunately, in Christchurch we also have access to a growing collection of automatic cycle counters scattered around the city that provide day-by-day updates of what is happening on the cycling front. You can easily access them yourself from CCC’s SmartView website.
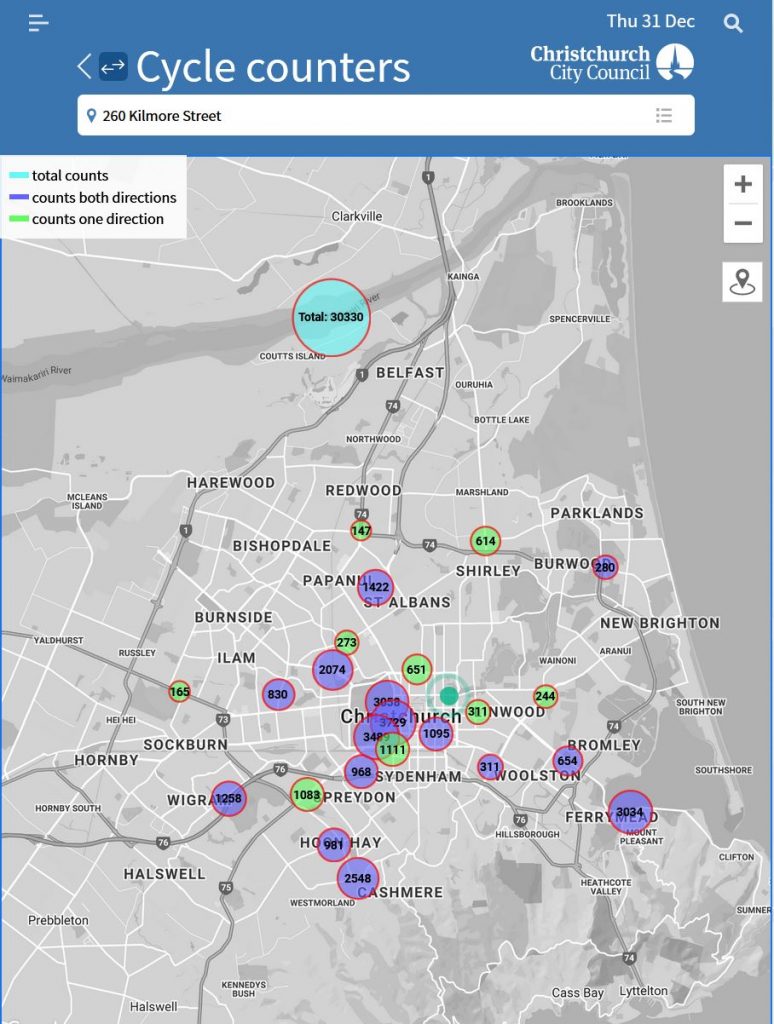
Approximately 25 sites are monitored; some since about mid-2016, while the newest site (Charles St on the Heathcote Expressway) has been going for a little over a year. As well as showing each individual site, you’ll notice that there is also an overall count total lurking at the top of the map (telling us that last week, during the Xmas break, there were still over 30,000 trips recorded during the week). And clicking on any of these site spots gives you a more detailed breakdown of the count history – you can even download the data (click the button on the right of the orange box).
Great, so it’s simply a case of looking at the overall count data and seeing the change over time? Well it’s not so simple as that, for a variety of reasons:
(1) The first problem is that, not surprisingly, cycle counts vary from day to day, especially often between weekdays and weekends/holidays. This issue is easily dealt with by having a rolling 7-day average – which is why SmartView shows you 7-day counts (as well as a plot of the daily numbers).

(2) The next problem is that even weekly counts vary considerably throughout the year. Summer tends to be busier than winter, work/study weeks are busier than holiday periods, and of course periods of good/bad weather also influence things. The chart below from our busiest cycle counter illustrates the kind of variations you can see throughout a typical year (right now, over the Xmas break, is easily the lowest usage).
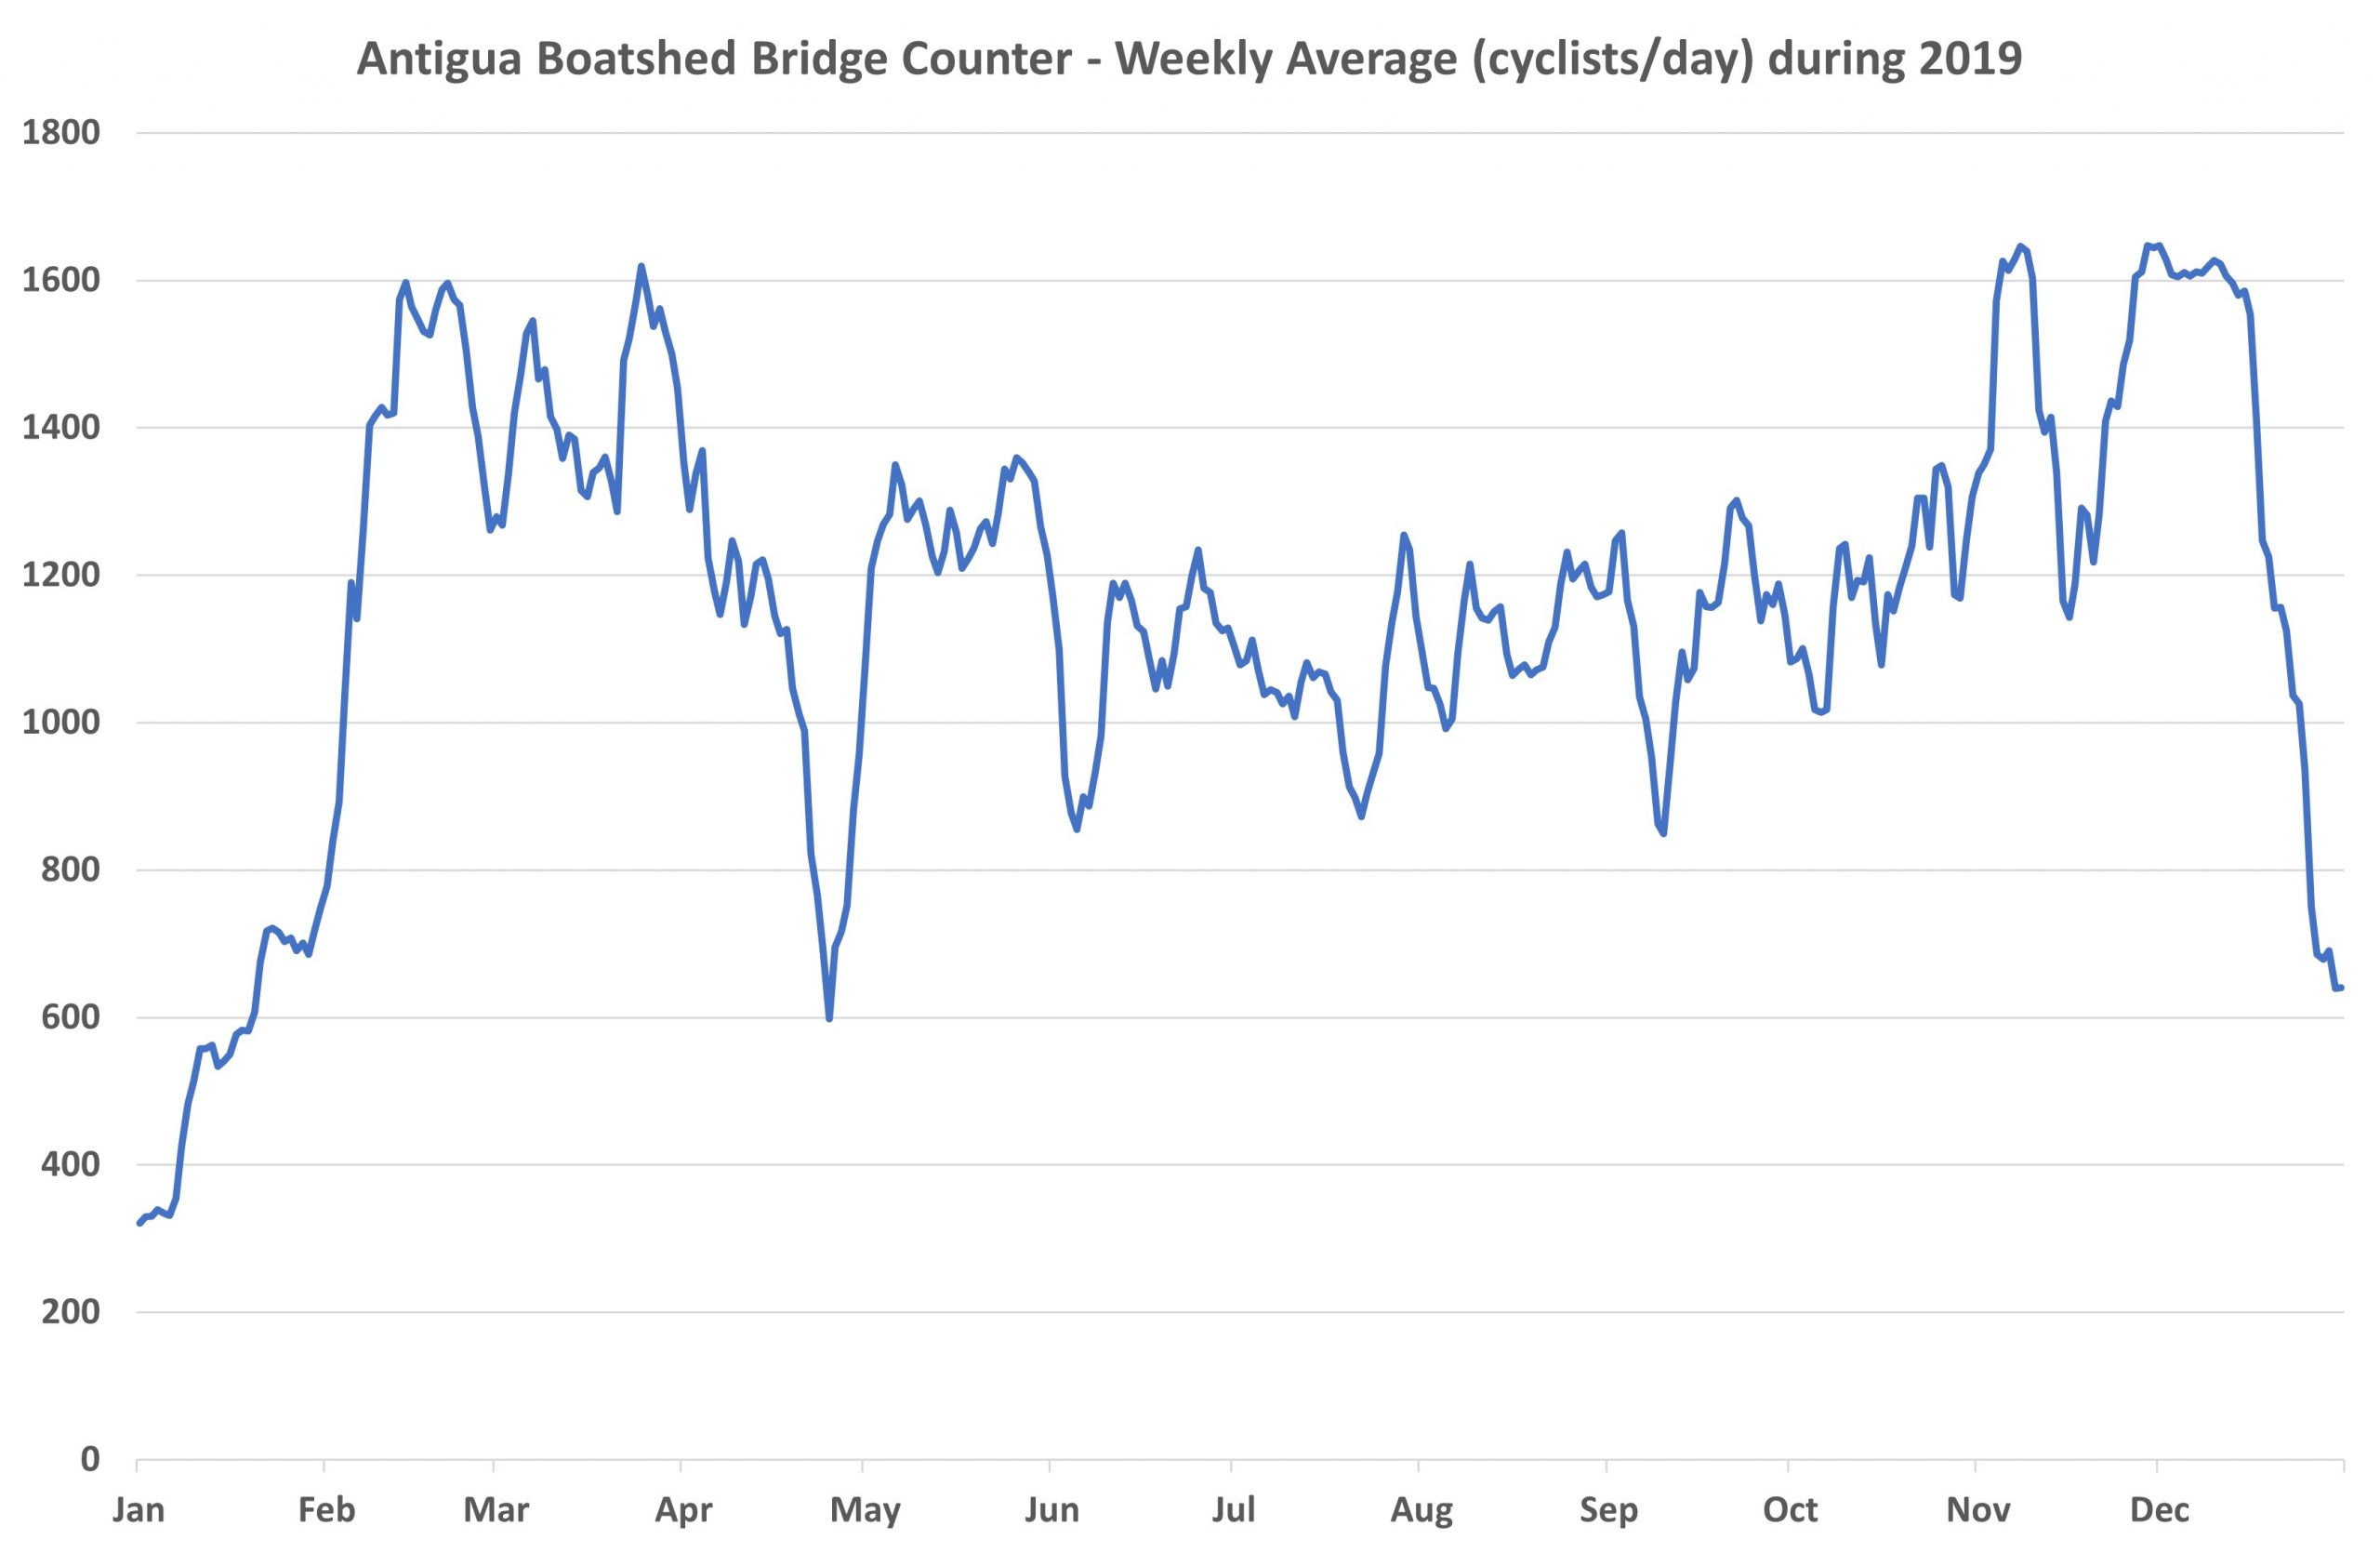
So it would be hard to look for a change in average cycle numbers between (say) July and February (perhaps after a new cycleway was built) while knowing that cycle counts typically drop away a bit over this period normally anyway. What’s the solution to this? Use a 12-month rolling average! That way you always have a complete year of data with all of its usual normal variations.
(3) The final piece of the puzzle is that the number of count sites has changed over time, as more of them have been installed. The (annual) average daily total of all count sites at the moment is ~9400 cyclists/day; three years ago it was only ~2500/day. Wow, what growth! Except that three years ago only 8 sites were contributing to that number; now there are 24. So we have to account for change in cycle numbers while also acknowledging the increase in places being counted.
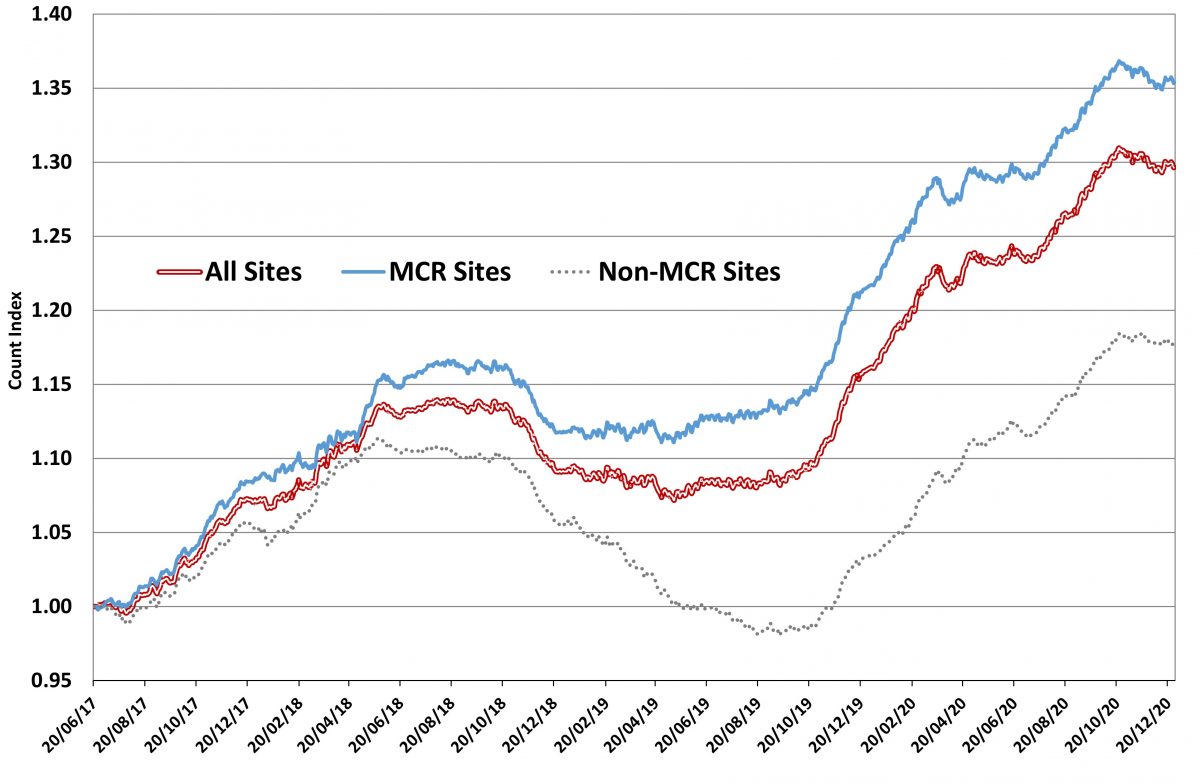
The following graph illustrates the change in cycling numbers at each of the city’s count sites (for conciseness, just the site ID numbers are given; “*” is a Major Cycle Route site, “>” is a 1-way only count). Each site’s annual average daily count begins one year after it was first installed and monitored, e.g. site 38709 on University Drive (solid purple line) first registered data in July 2017, so we have a plot here from July 2018 onwards.

A graph like this has a lot to take in, and it’s certainly not easy to discern an overall trend over time. Some are going up a lot; some not much at all. The best way to get an overall picture of what is happening is to calculate an “index” that shows the relative change from one day to the next. Some simple rules were used:
- The index started in June 2017 with a value of 1.00. If the amount of cycling increased by (say) 5% then the index would climb to 1.05, an increase of 12% = 1.12, etc.
- The total counts for each day across all sites were summed up and compared with the sum from the previous day. The ratio of the change was applied to the index from the previous day to get the new index value.
- If the number of sites being counted changed from one day to the next, then the index was left unchanged for that day.
With all that in mind, it’s then pretty easy to get an overall indication of how total cycling counts have been changing over the past 3 1/2 years, as shown in the next graph:
What you can see is that overall there has been a 30% growth in cycle numbers across the entire count network. Clearly driving this is the development of the Major Cycle Routes, as the counters along these routes have recorded a 35% increase over that time – basically 10% per year. Even the sites on non-MCR locations have seen some growth too though, with about 18% increase overall.
An interesting observation is that the growth hasn’t been constant; in fact there was a period between mid-2018 to mid-2019 when it was flat or even falling slightly (remembering that this data is actually capturing the average for the 12-month period before these dates). Meanwhile, either side of that was some very rapid growth in numbers. It might be worth trying to correlate some of these trends with when certain bits of cycle infrastructure were opened (certainly, given the current rapid rollout of new cycleways, next year could be another one to watch too…).
The lingering question in the background is also: how has COVID-19 affected the numbers? Certainly during the lockdown period earlier last year, there were dramatic drops in cycle numbers along some of the key commuter routes into town. However, at the same time, some of the outer suburban routes recorded notable increases in cycle numbers, as families got out and enjoyed the quieter times. That is very evident from the multi-site chart above, where some sites dipped down during April/May 2020 while others jumped up. The net effect on the overall index was relatively little change during lockdown and then it continued to climb up again afterwards…
I know that some detractors will point out that these counters may pick up the same person more than once on their journey, so an average of 9400 recorded bikes a day across the city isn’t likely to translate to 9400 individuals biking that day. However, a lot of cycle trips in Christchurch don’t hit any of the cycle counters around town (case in point: my usual ride to work and back each day). The Census and Household Travel Survey data would indicate that over 50,000 cycle trips a day are being made on average, which shows you how much cycling happens far away from any of the counters. It would be silly not to expect that these numbers aren’t also growing as well… {P.S: scattered counter sites is how we also count motor traffic…}
So the take-away from the data story seems to be that cycling continues to be on the up-and-up here in Christchurch; great to see. I’ll continue to keep to an eye on how the numbers are tracking; it would certainly also be nice to see a few more count sites to fill in some of the data gaps around the city.
{P.S: By complete coincidence, Chris over at Talking Transport has also just published a blog post looking at Chch cycle counts – see his musings here}
Have you noticed more people biking around Chch in the past few years?
Cycle #’s on Montreal Street up to Bealey Avenue appear to be increasing now that the green paint has been put on the lane, the pinch point at Salisbury, Victoria intersection has been eliminated. It surprises me also how many bikes turn off Bealey Ave into Springfield Road which can be a hotbed of close passes at times. This option is faster and more direct than the Papanui Parallel. If there ever gets to be capacity issues on the Papanui Parallel, along Colombo Street, through to Rutland Street , Montreal St may become even more popular.
My cynical reason for choosing Springfield road is that it has a give-way at the top end, not a red stoplight. So I don’t have to wait as long on average. I also strongly dislike the Colombo street lanes – being on the left of parked cars has bitten me before.
Nice article, I like the idea of indexing it back so there’s a clear number to report – 10% growth year on year is not too shabby. Any ideas why the the numbers indicate a drop in use through 2019? Looking at the breakdown, it seems like most counters recorded growth but South Hagley Park had a massive drop-off which is causing the overall drop. Could it just be due to some isolated incident – broken sensor, roadworks etc.?
There are quite a few other counters that also show a “sag” from mid-2018 to mid-2019, so it doesn’t appear to be just all on one site. But casting our mind back, 2018 was the time that Oxford Tce and Antigua St near the hospital were being reconstructed, which necessitated a number of detours for cyclists. This may have put some people off biking this way at the time?
Very impactful to see overall counts combined in a single MCR/ non-MCR graph. Looking forward to biking a couple of the routes over coming weekend.
Hello
Thank you for the excellent analysis but I have a question. – When I go biking, I normally take two trips out and in. Does the 9400 refer to trips or have you halved 18800 to get the number of cyclists?
Regards
James
Hi James, this is based on the actual number of bikes detected crossing the counters – if you cross them twice then you will be counted twice. No different to any motor traffic counter; it just counts what crosses it. It’s not always the case that a simple halving of these counts will give you the number of riders; some people may bike along different routes back and forth, while other people may make multiple trips in a day. Also note that some of the counters only record bikes in one direction only anyway.
Thank you LennyBoy
Kia Ora Team,
Do we have updated counts of cycle numbers?
I’m especially interested if half price bus fares have attracted back commuters. Will also be interesting to see what will happen when the cut price bus fares are lifted mid-winter.
Great news we are also getting 100 new buses (electric?). What will a “turn-up and go” bus service do to long-term cycle commuter numbers?
Warm regards Bill G 🙂
Kia ora Bill, There have been two annual updates on these numbers since this post, the latest recently in early January – https://cyclingchristchurch.co.nz/2023/01/21/chch-cycle-counter-update-2022-lockdown-jitters/. Even that data is probably out of date, as various counter records have been broken since then during February…
It will be interesting to see what effect bus fares have had (and will do), although I seem to recall that Canterbury had agreed to continue with discounted fares for target groups. In the past I suspect that the development of the cycleway network has certainly attracted new people from bus users as well as motorists, although some early research had identified more take-up from driving – https://cyclingchristchurch.co.nz/2017/12/10/are-major-cycleways-working-first-surveys/