
Happy New Year everyone! I’m glad to see the sun popping out a bit today as it’s been a bit up-and-down weather-wise as a summer holiday period so far.
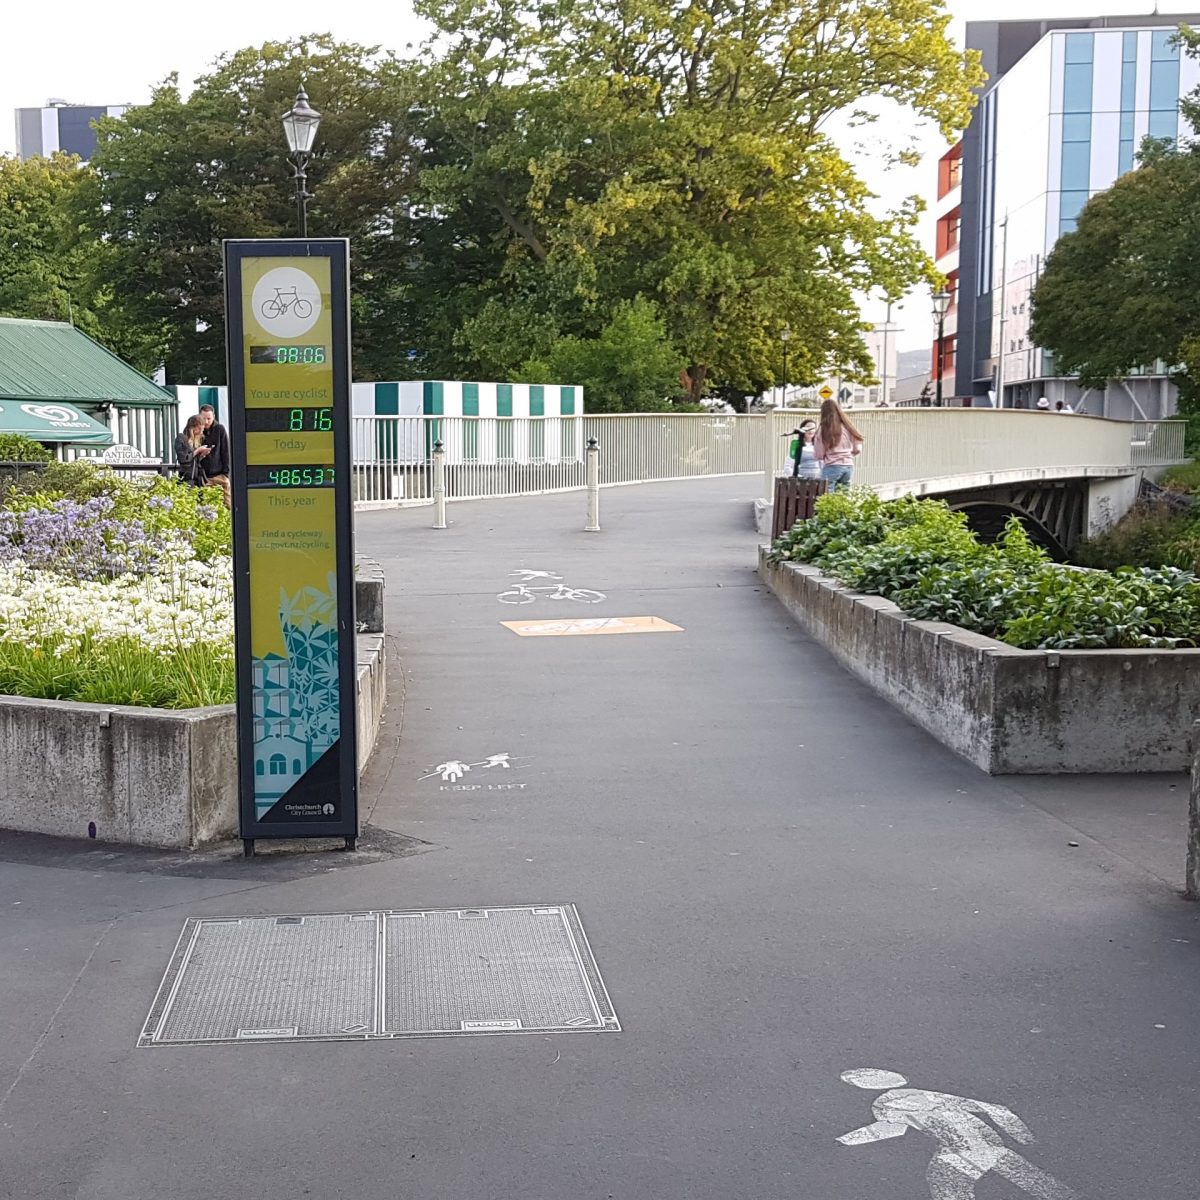
Still, as we’ve learned previously, people cycling in Christchurch are a reasonably hardy bunch, with relatively little impact of the cold or wet on cycling numbers. And never is that better illustrated than with the counts seen at the Antigua Bridge cycle counter:
I took this photo, just after 8pm on New Year’s Eve, so there probably weren’t many riders left to come across for 2019 (I saw at least a couple more after I took the photo). Not surprisingly for a holiday period, the daily count was “only” 800-odd, but as you can see the total figure for 2019 was well over 486,000 cycle trips across the bridge (and, as we looked at earlier, the accuracy of the counter seems pretty good). If you do the maths, that works out to an average of more than 1300 bike trips a day in 2019. (For the record, the highest day last year was 5th March, when 2342 people biked across the bridge)
So now it’s 2020 and the annual counter has reset. Will we see the cumulative count top half a million rides this year? Let’s see…
How often did you ride past this counter last year?
I don’t go that way very often anymore – maybe 5 times a year? Now that the Promenade is open, that’s the easiest way for me to get across town to work. I was a bit disappointed when I realised my daily commute wouldn’t take me past the counter anymore, but I’m too lazy to go past & double back just for the little joy of seeing myself get counted. And it makes the few times that I do go through there that much sweeter 🙂
This is a little odd. If you add up the numbers for 2019 that you can download from Smartview for the Eco Counter, there are only 413,963 trips counted in 2019, for an average of 1134 trips per day.
There was a period of time last January when one of the detectors at the bridge wasn’t recording, although oddly I think the counter was still counting them.
Hmm, the Smartview counter does count 18,787 trips in January 2019, but there is a discrepancy of 70,000 trips for the entire year numbers. If the January blackout alone were to account for this, there would need to be around 90,000 trips in January 2019 (the recorded ones and the missing 70,000). This would mean that during January 2019, the daily average would have been closer to 3,000. I would think that wasn’t the case, and instead, the missing numbers are spread throughout the year.
One way or another, it seems to me that the Smartview data is significantly under-reporting the numbers (given that we can see that the Ecocounter itself is very accurate). I wonder if this is a widespread problem, or just a
Hi Lenny and Jan,
I’ve been researching where the difference between smartview and the counter comes from for last couple weeks and we got to the end. There was some slight issue in the API processing on ecocounter side which has been fixed, but SmartView caches the data so it kept using the pre-fix data and it wasn’t much per day but obviously cumulatively it added up. I’ve recached all the data and seems to be matching what EcoCounter has so hopefully it is all good.
Let me know if anything similar happens again please, I discovered by luck just browsing the comments here 🙂
Great to hear that Michael; either way, SmartView is a well used resource!