
It’s been about two years since I last had a good look at how cycling numbers have been trending across Christchurch city. At the time (March 2024), the numbers were very encouraging, with good growth across Major Cycle Route sites. Even after that, the trend continued to climb for much of 2024. But the picture has been a little more uncertain since then…
As you may know, Christchurch now has 33 cycle count detectors across the city, picking up data on cycling numbers every day. My analysis involves monitoring the changes over time for each site on a rolling 12-month average basis and then seeing what the overall relative change is (holding steady the growth when count site numbers change). So how have things fared in the last couple of years? Here’s the latest chart…
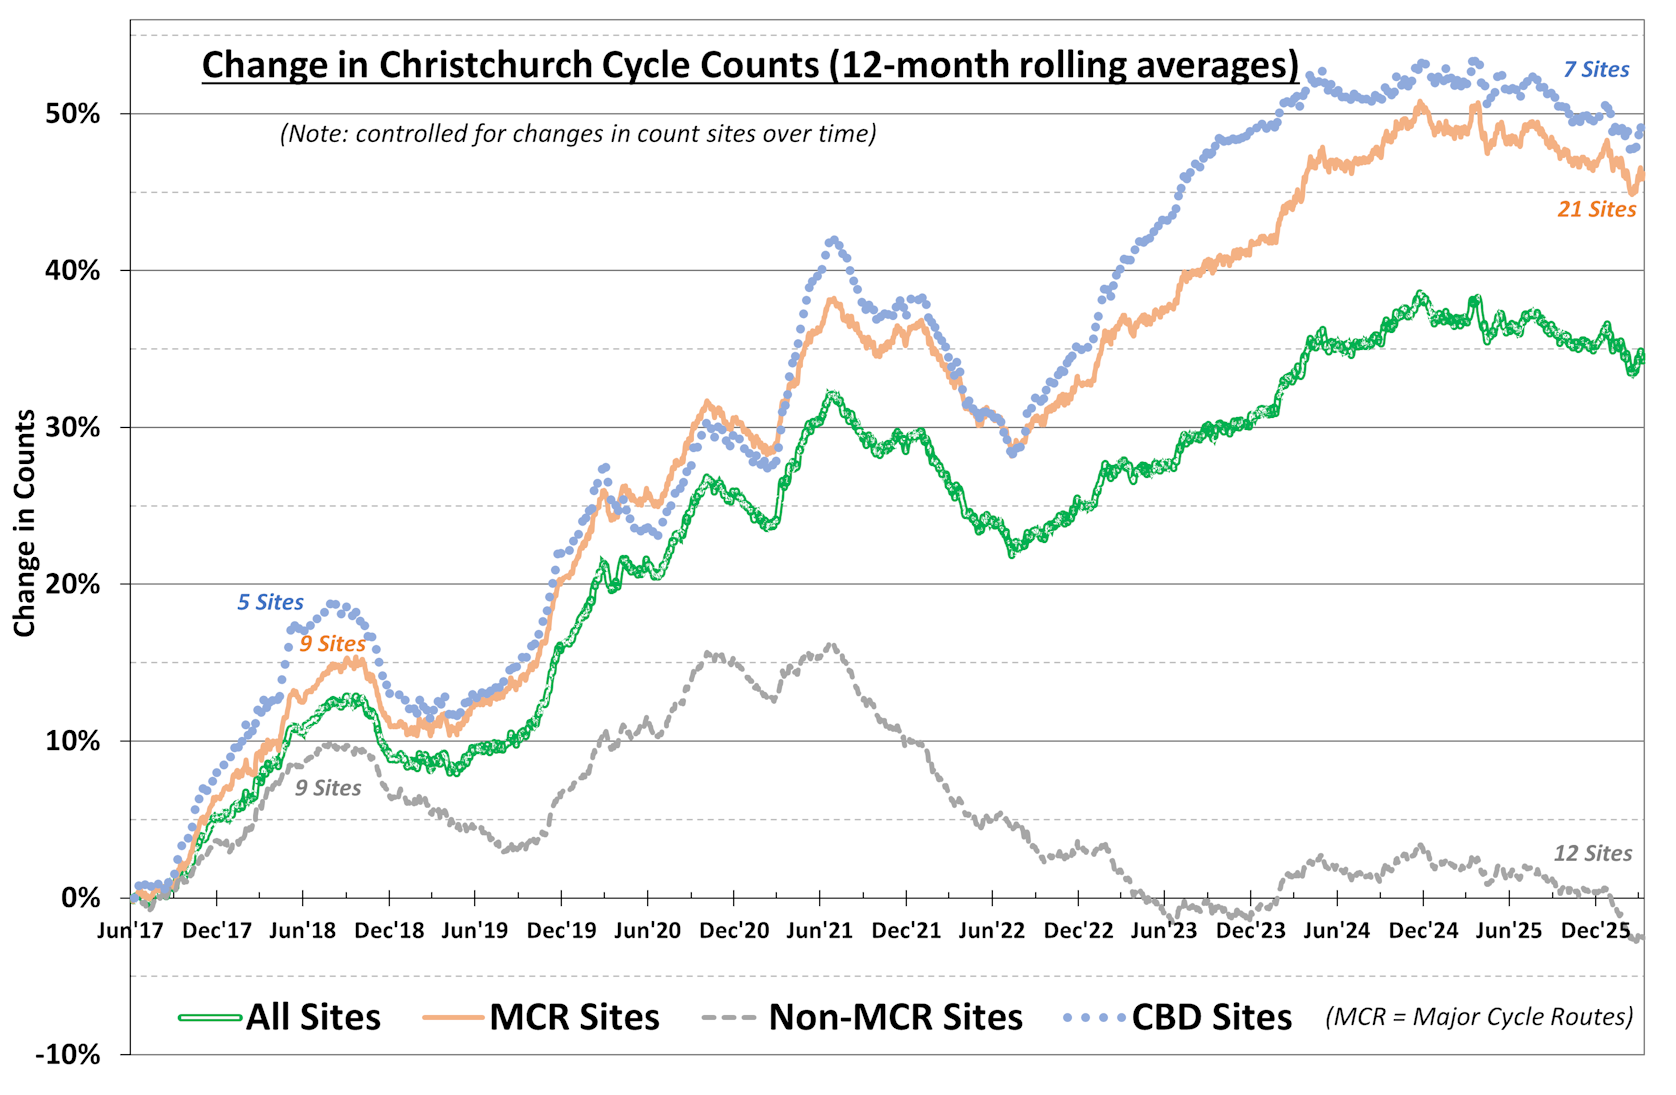
As you can see, the picture has been a bit flat (and even declining slightly) since late 2024. It’s hard to put a finger on what’s behind this, although the City Council’s appetite for cycleways since the current Government removed any funding for them has certainly limited how much the cycleway network has continued to be rolled out. It possibly didn’t help either that last year’s winter in Christchurch was the coldest in a very long time, which can drive down cycling demand.
However, there may be a silver lining in the form of the recent fuel price hikes across the country. As reported previously, this has seen a surge in the numbers of people switching to cycling in Chch. If you look closely at the chart above, there is a slight uptick right at the very end. And when I compare February 2026 average cycle counts to March 2026 averages, there’s been an overall surge of about 6%. Let’s hope that trend continues, as more people give cycling a go and realise that it’s not a bad option…
Have you noticed more people cycling in Christchurch?