
It’s a regular trope I see often on social media of all stripes – we shouldn’t bother doing much for cycling because it’s only a tiny fraction of the population we’re catering to. This confusion seems to stem from the the fact that currently the total proportion of trips made by bike is relatively small; even in Christchurch it’s only about 3% of trips. But that doesn’t mean only 3% of the population ever cycle. And in fact we have a good series of data telling us that quite a lot of people get on their bikes here…

Every year, the Christchurch City Council conducts a survey of a random selection of residents, to ascertain their general satisfaction on all sorts of local council matters, including housing, parks & gardens, roading, rubbish collection, etc. It’s a useful barometer of how well (or not) they are doing in various areas of Council services.
Two cycling-related questions are surveyed in this Annual Residents’ Survey. The first one asks whether people agree that “Christchurch is a Cycle-Friendly City”. The good news is that this has been fairly consistently high for the past few years, hovering at a little over 60% who agree or strongly agree and only about 12% who disagree (the rest being neutral or not sure).
The second question asks how often residents have cycled on a public road in the last 12 months. And year after year, this has shown consistently that at least 50% of residents have done so; in fact the number is creeping up towards 60% now. What’s more, of those people, over a third have actually cycled at least once a month, and over 20% at least once a week. Suddenly, that’s not such a small fraction we’re talking about…
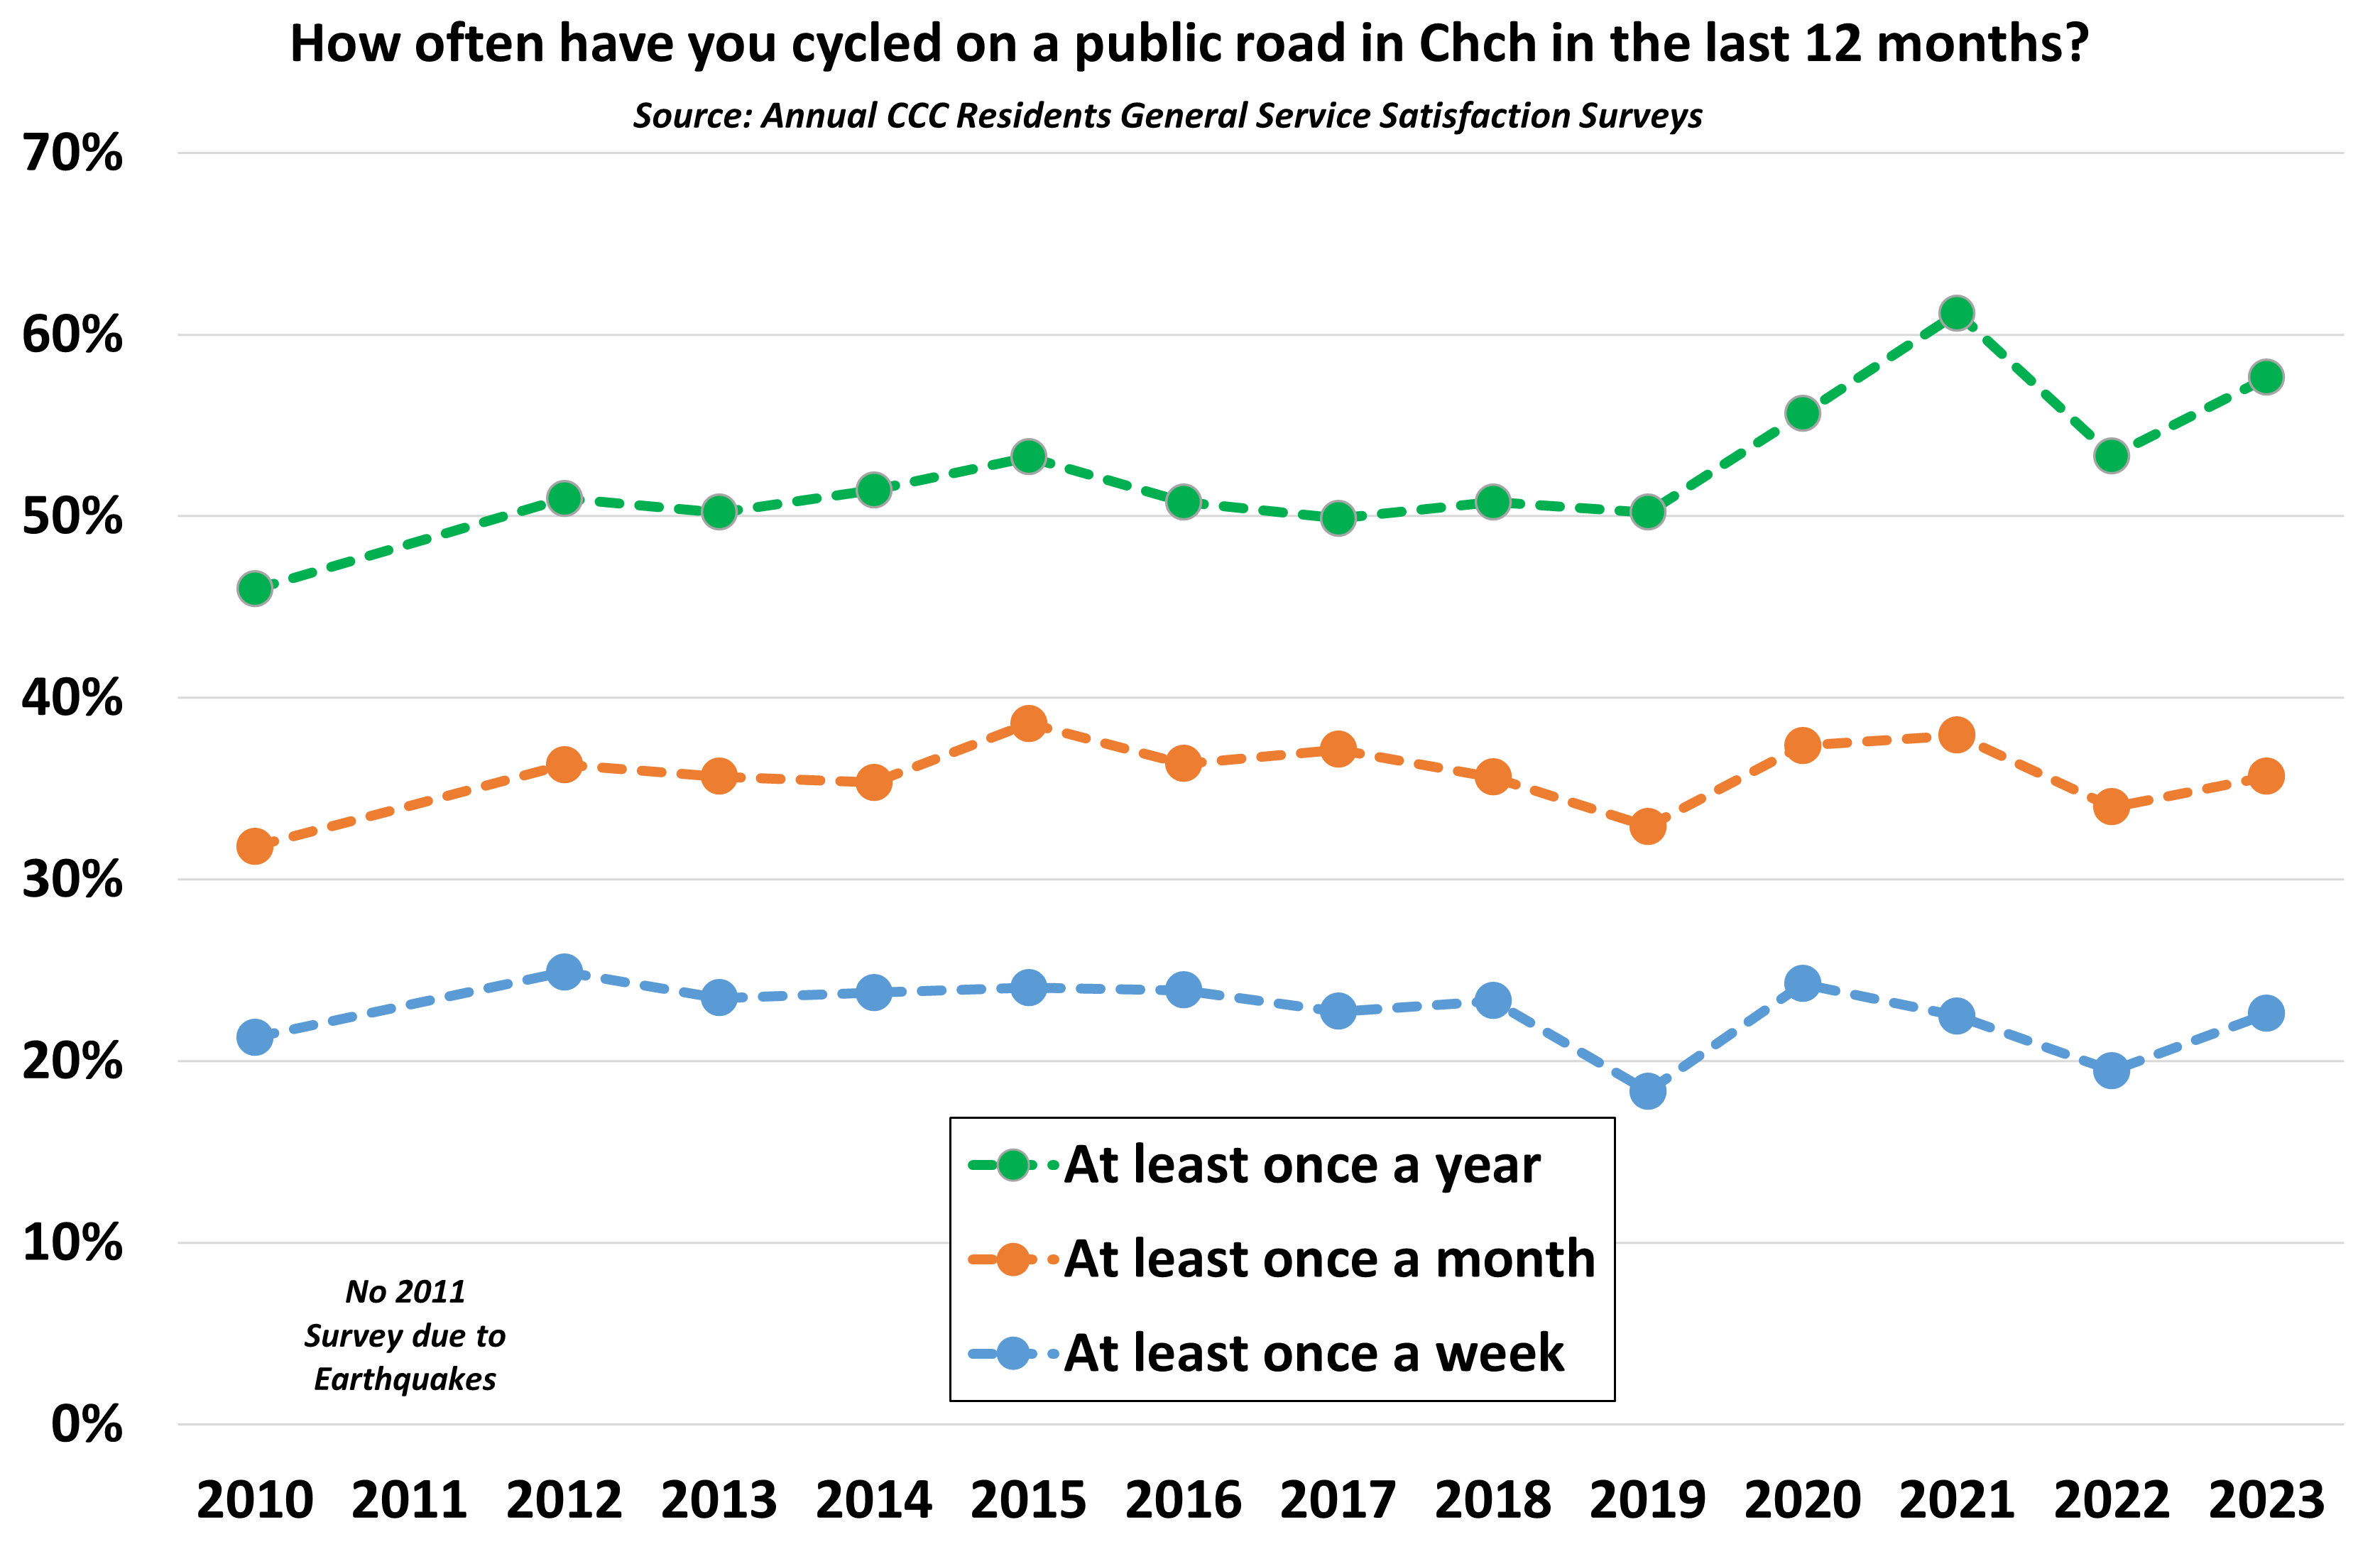
It appears that we’re ahead of the average for the country too. The latest Ministry of Transport Household Travel Survey also asks a question about cycling frequency and, across the country, the proportion cycling in the past year was a little over a third.

So that’s great news about the numbers who are cycling (and it will be very interesting to see what the Census data tells us in a few months about the change in commuter cycling). The other interesting snippet that was shared recently was the finding that over time we are also seeing more women and girls taking to their bikes in Ōtautahi…
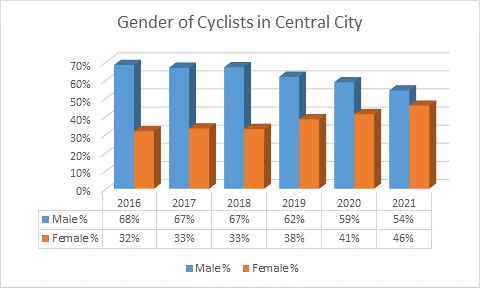
This data comes from an annual count survey undertaken of riders entering the central city via various routes, with manual surveyors assessing the gender of each person riding past. Yes, it can be an inexact science guessing gender (not to mention those who identify as non-binary…) but the numbers are probably good enough to indicate a clear trend (By the way, the graph doesn’t mean that fewer males are cycling – just that the increase in females is greater…).
All this mirrors the same trends seen in the Annual Residents’ Survey mentioned above: If we take those same years, then the proportion of males riding at least once a year went from 62% in 2016 to 63% in 2021 – for females the same figures riding at least yearly went from 40% in 2016 to 54% in 2021…
Why does this matter? Because, in looking at the best performing cycle places in the world, a notable feature is the fact that they typically have parity in genders cycling (indeed, sometimes more females on bikes). To generalise, females are usually more risk-averse so, if you can create a cycling environment that they also want to ride on, then that’s a strong sign you’re doing a good job…
Have you noticed more people cycling in Christchurch? Have you noticed more women cycling?
Thanks for presenting summaries of the various recent surveys.
Yes, the data is encouraging.
Do you know if there were any sample bias in the surveys and, if so, how was it mitigated?
Cheers
The reports (found at the bottom of the Council webpage) gives more details about the methodology but basically the market research company randomly samples people from across the city and ensures that there is a geographic and demographic balance matching the city’s stats. And because the cycling questions are just 2 out of a lot of different questions, you’re not really going to get the situation where (say) only regular cyclists complete it.
This isn’t like some other Council surveys where they ask you via email, social media, etc to answer some questions about some topic (housing, transport, city life, etc) – there is probably a greater chance of sample bias there.
Thanks for the detailed response. Appreciated. I’ll check out the report links you mentioned.
I’d be interested to see the totals year by year.
Are the samples from the same location, same weather, same day of week?