
The new cycleways continue to be rolled out around the city, starting to build up to quite the connected network now. Which begs the question: is it making a difference? And has Covid had an impact on things?
A year ago I presented an analysis of the cycle count sites around the city over the past few years. Taking a rolling annual average for each site and monitoring the day-to-day change in numbers, it was evident that there had been very good growth across the cycling network – particularly on the Major Cycle Routes where growth was averaging 10% per annum.
So has it continued? Again, I went back to the (now) 29 count sites at CCC SmartView to check the daily numbers. Three new sites have been added this past year, at Waimak Bridge, the Northern Arterial pathway (Redwood), and Peverel St (Riccarton). However, none of them has been in for at least a year, so their data is ignored for now and we’re left with the 26 sites that were analysed last year. Here is all of their individual data up to the end of Dec 2021:
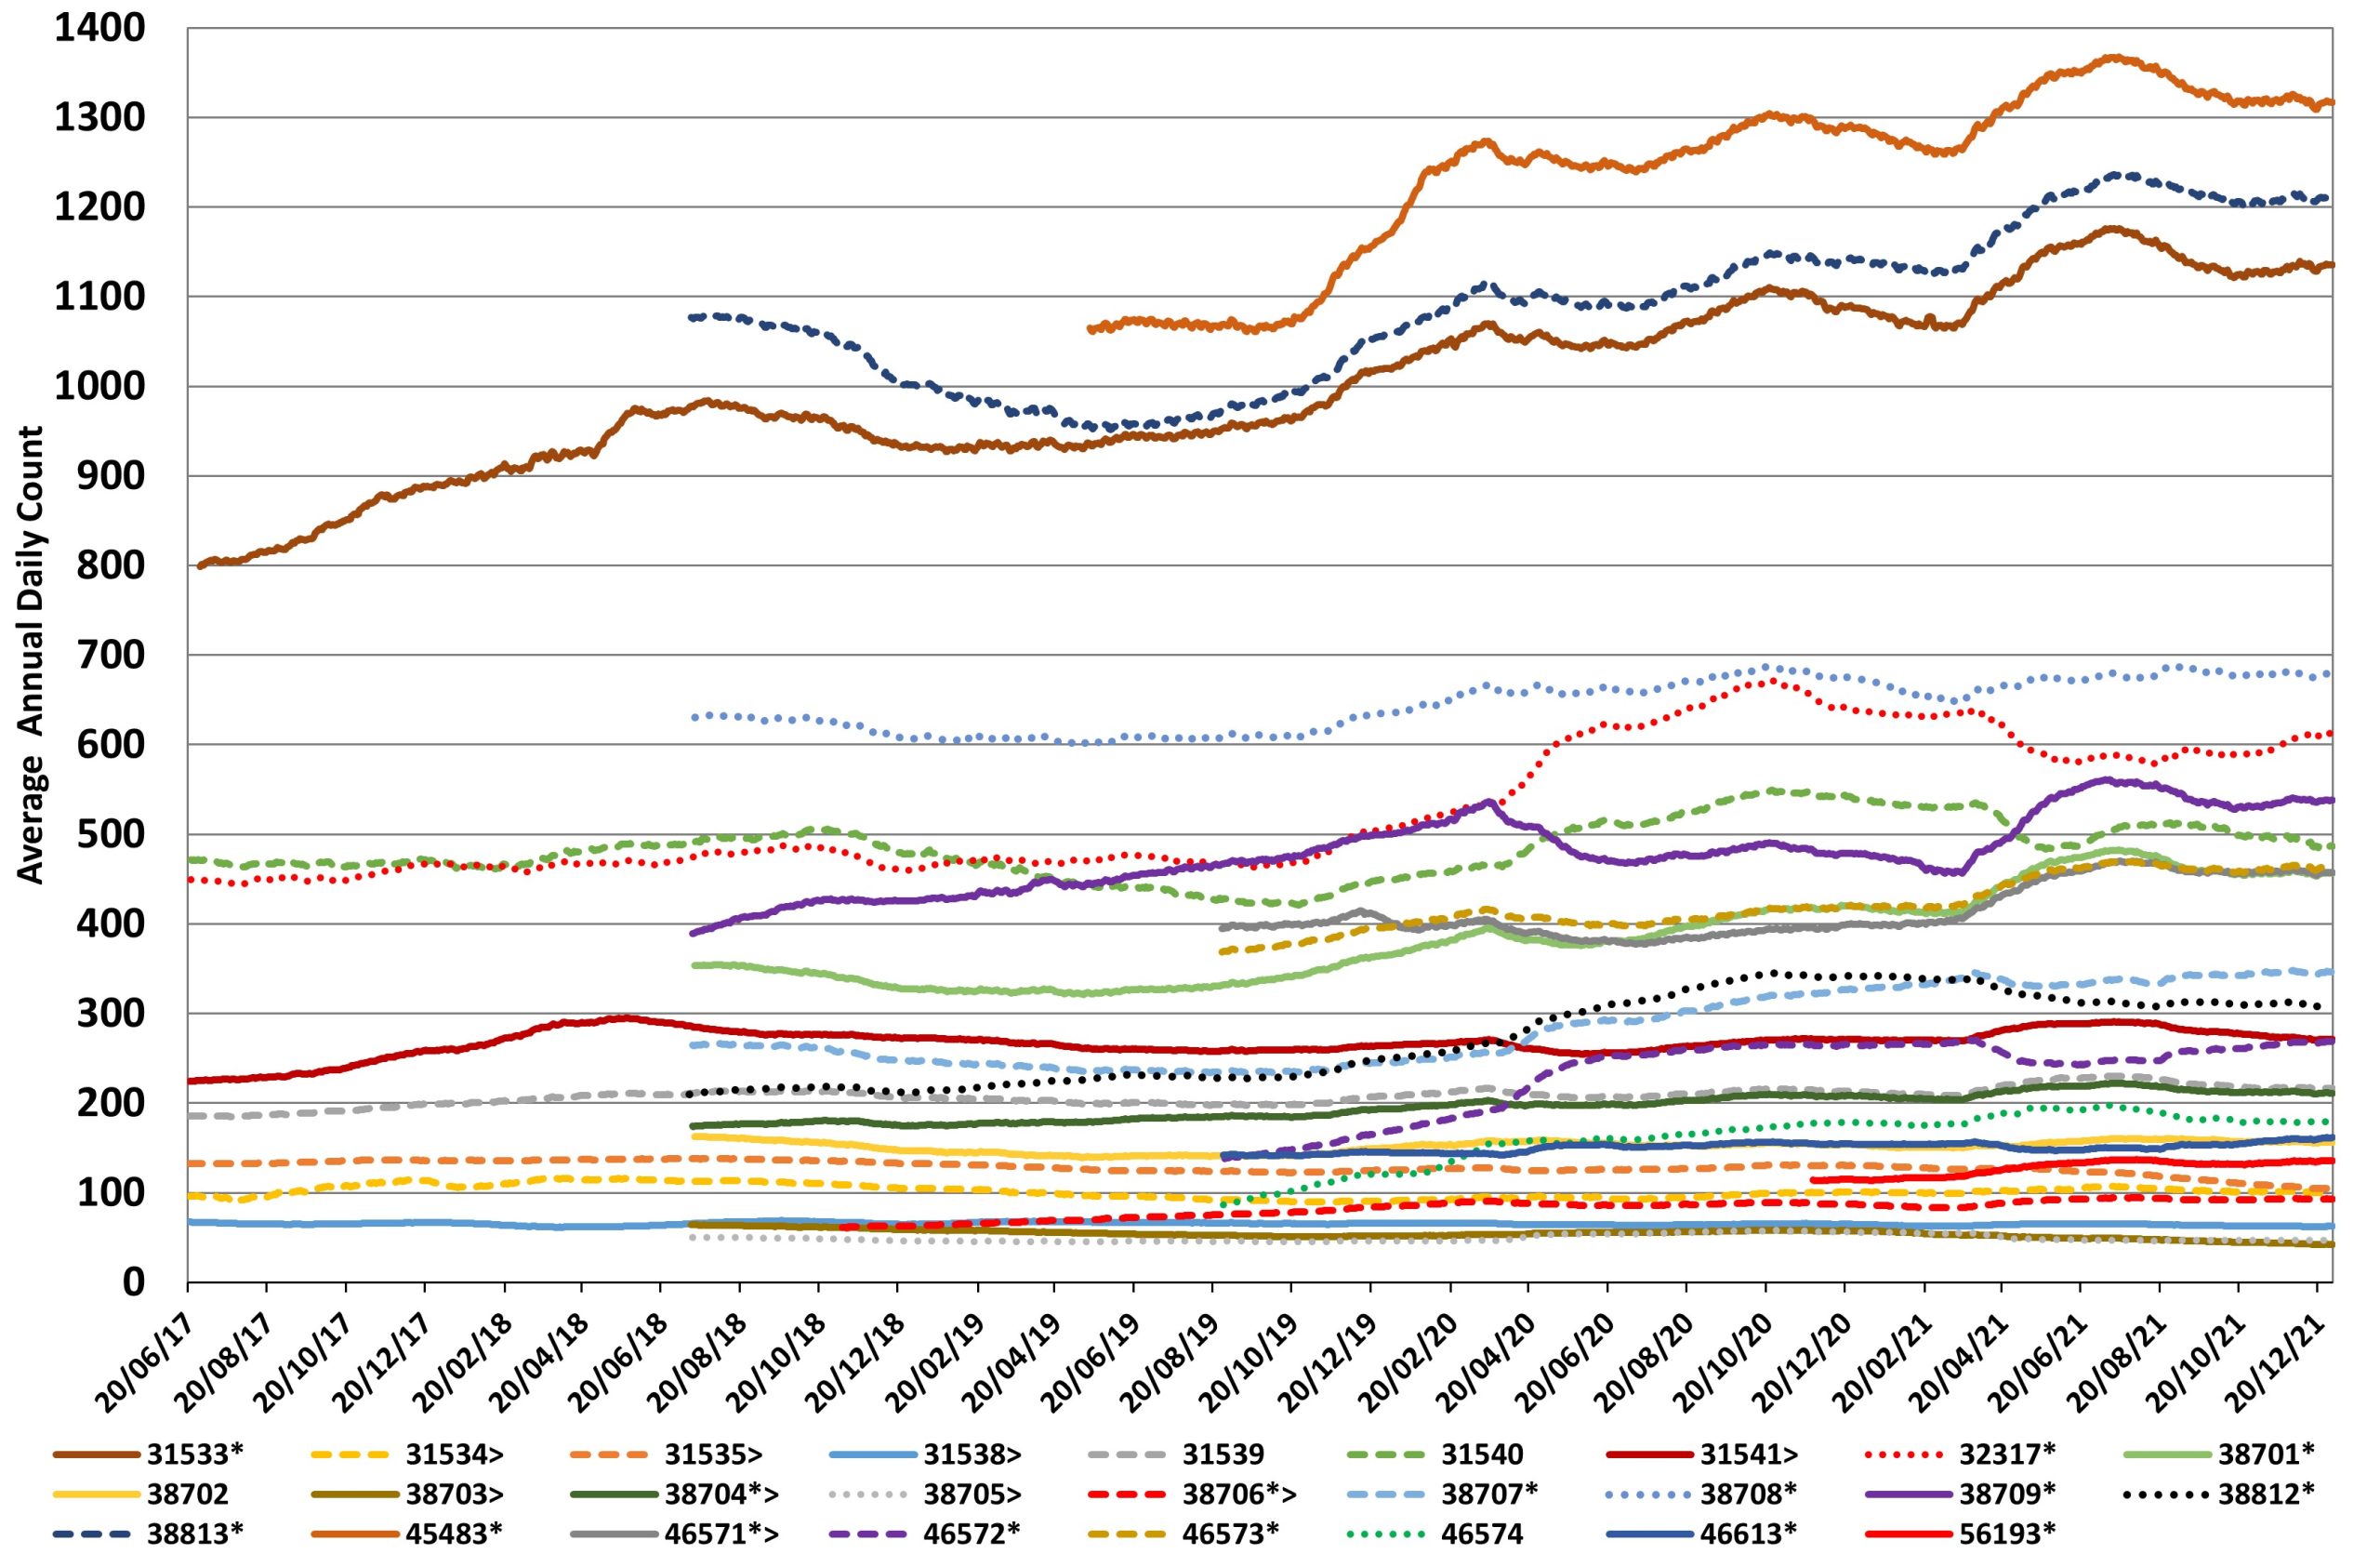
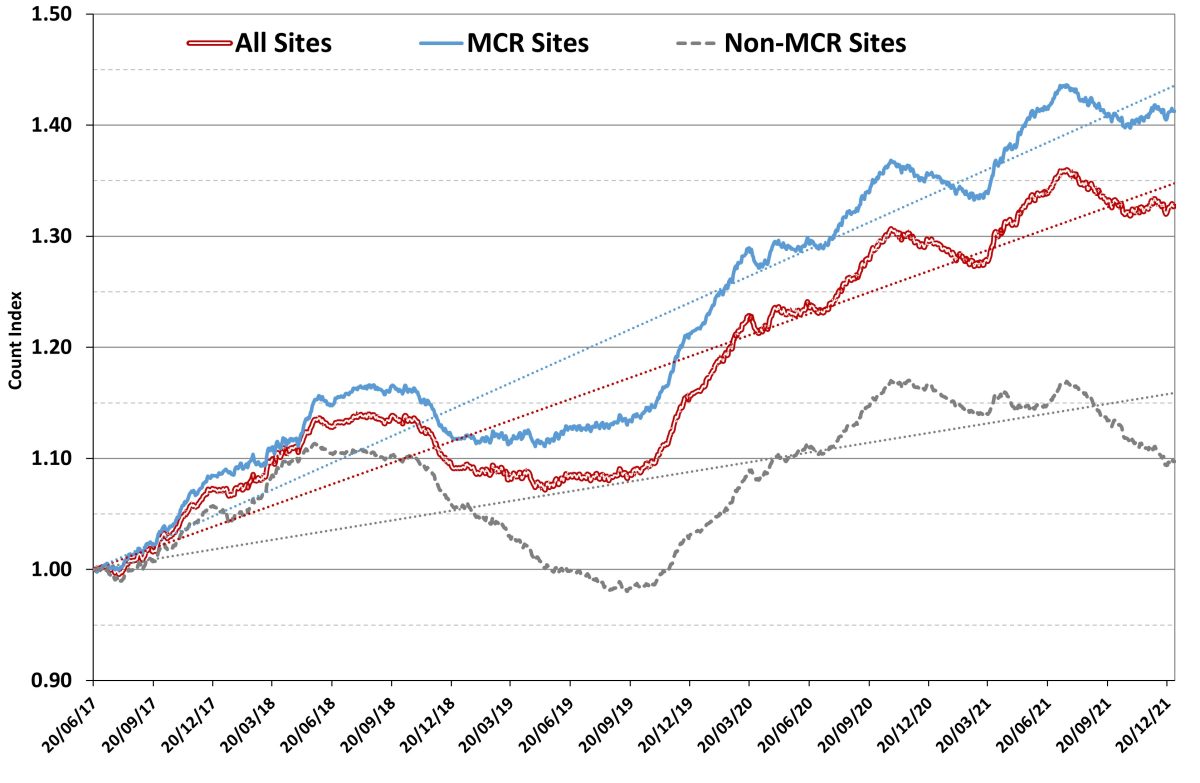
As always, it’s very hard to discern what is going on at many of the individual sites; it looks like some have gone up, some down, some flat-lining… So again, we will combine the counts to see what the relative change is from day to day…
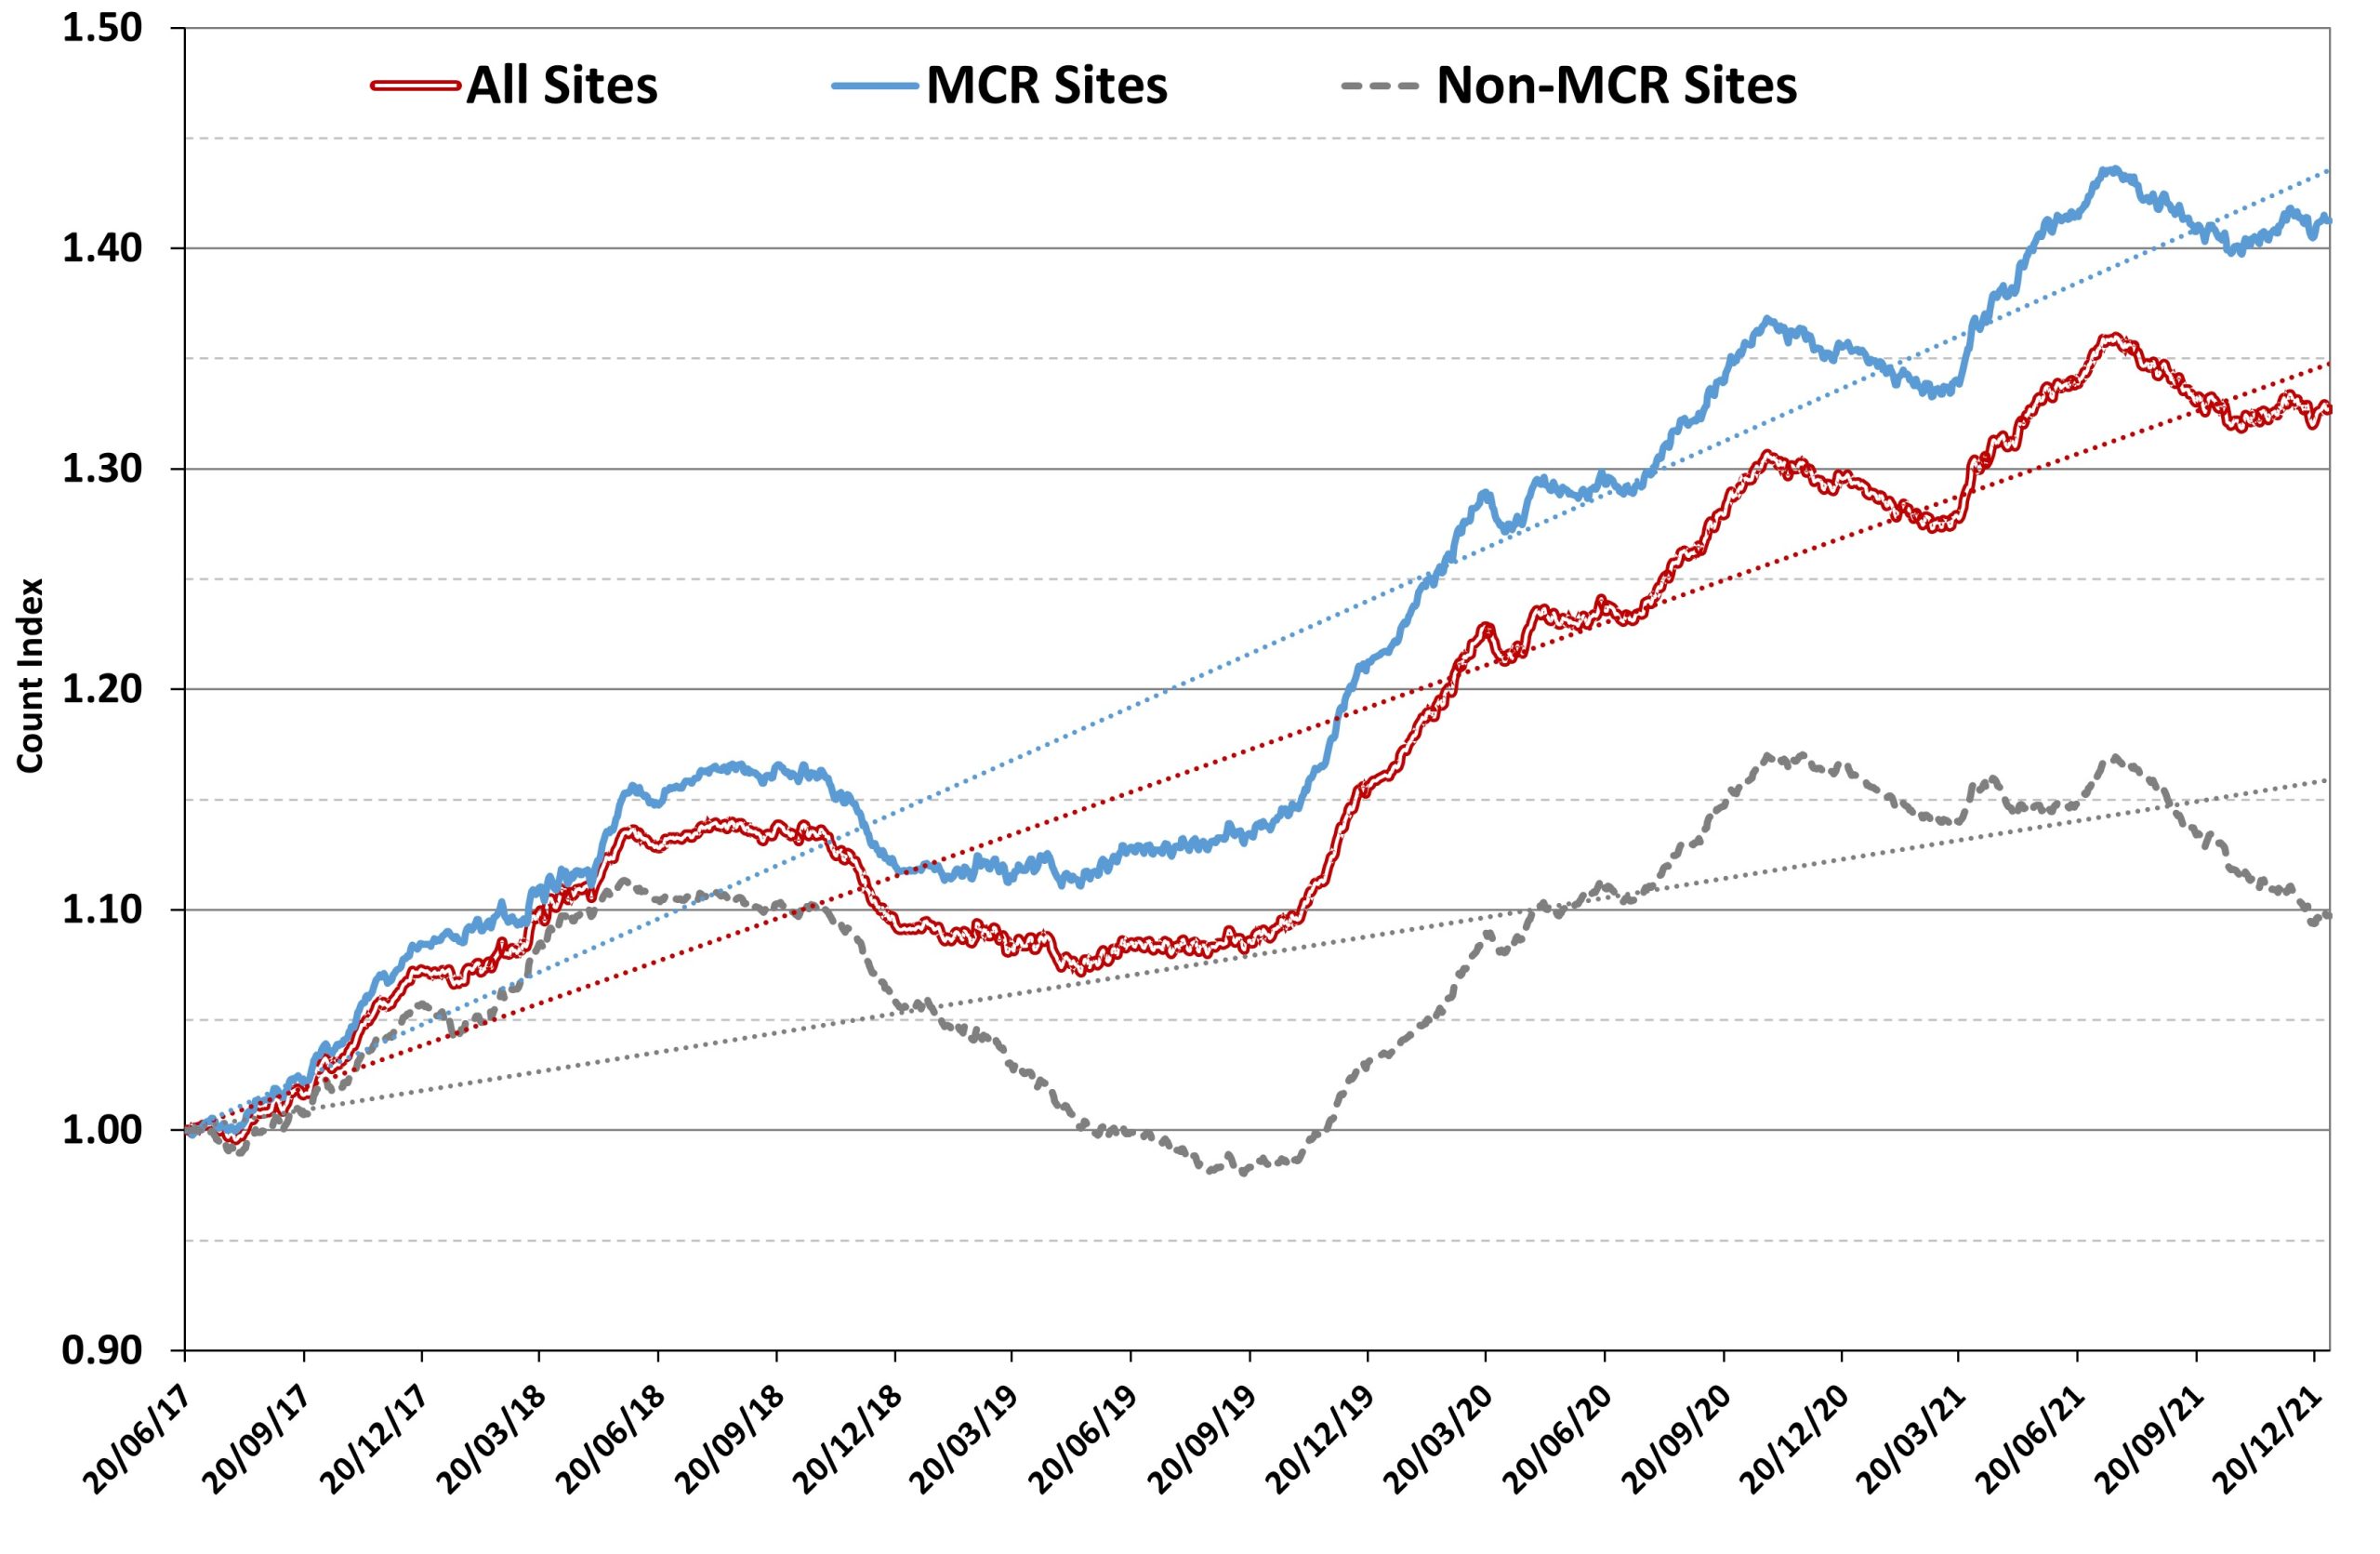
Now there are some clear patterns showing up – and the clear trend continues to be up, especially so for the Major Cycle Route sites. By mid-2021, the MCR sites had increased in count by over 40% since mid-2017 – i.e. at least 10% growth per year.
Interestingly, the past six months have seen a levelling of cycling demand, with no further growth and even a little decline. Is it coincidence that we began to be in national lockdown from August and have continued to be experiencing somewhat reduced activity around the place under the traffic light system? Certainly I’m amongst many who are currently limiting their travel to their work or study place, and working from home instead (still getting my daily bike rides though!).
As always, it’s hard to read much into short-term changes in trend, but the ongoing long-term trends continue to tell a promising story. Even taking into consideration the second-half blip, there has been an absolute increase over 5% in cycle counts within the past year. The “network effect” is starting to become a thing…
Have you noticed an increase in cycling numbers where you ride?
Does this suggest that as the MCR become more connected riders are re-routing their journeys? The chart showing MCR and non-MCR trends suggest this could be the case. Would you mind completing a quick assessment of a couple of corridors where there are parallel traditional routes vs new MCR routes.
I know I’ve used the Southern express a couple of times in preference to Clyde Rd (I don’t use Uni-Cycle as feels a bit out of the way/convoluted and I’m a “any where/any-time” rider.
Kia Ora
Would be interesting to see a baseline trend for cars, freight and bus passengers on the graphs.
My intuition tells me that exbus passengers are moving to cycle.
petrol prices could be having an effect to. Great to see so many people using our local cycleway who no longer need to take the car for short journeys any more.