Chris Morahan, over at Talking Transport, has been musing about the cycleway count stats for Chch…:
Recently somebody said to me something to the effect of:
“we shouldn’t be building cycleways because even if they’re OK in summer, nobody will ever use them in winter”.
I thought I’d take a look into this claim.
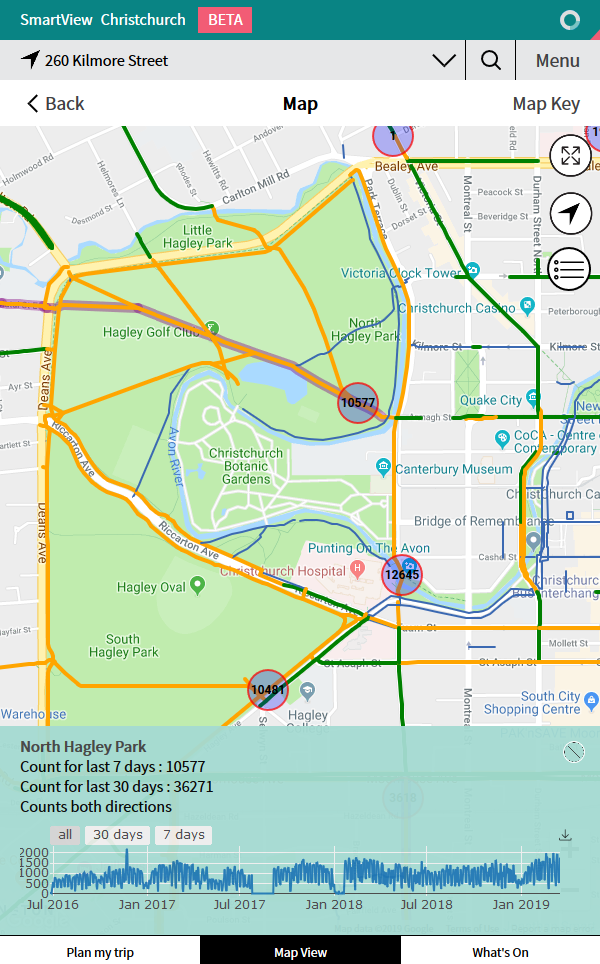
A few weeks ago I wrote about some results from the last 6 months of data from the network of cycle counters that Joe had helpfully compiled. Following that, a guru from Council got in touch and very helpfully added a new feature onto Smartview – a button that lets you see and download all available historic data from each count-site (see bottom right of screenshot below).
The counter at North Hagley Park seems to be the one with the most data, being installed nearly 3 years ago in July 2016. I’ve had a closer look at this one. As you can see from the screenshot above, there are a couple of periods where the counter looks like it was broken, so I’ve put in some dummy data there.
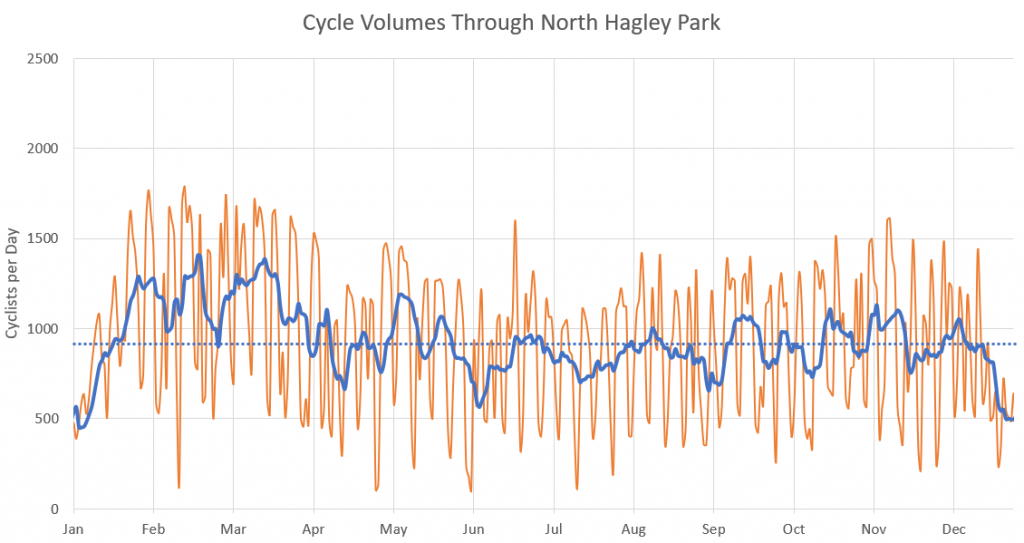
The graph below shows the raw data for all of 2018 in orange. I’ve then drawn a 7-day rolling average in blue. The year-round average of 931 cyclists per day is shown as a horizontal dotted blue line.
This shows that the lowest numbers are during the holiday period in December and January; the numbers peak in February and March; then they drop off in April, and are pretty steady from April right through to December.
I worked out the average cycle numbers in each season, together with how much higher or lower it was than the annual average:
- Summer – 950 cyclists per day (+2%)
- Autumn- 1,020 cyclists per day (+10%)
- Winter- 832 cyclists per day (-11%)
- Spring- 918 cyclists per day (-1%)
Summer includes both the really high periods, and also the really low periods when everyone is away on holiday. If you exclude the period from the 21st December through to the end of January, then the summer figure jumps up to an average of 1,024 cyclists per day (+10%).
This data debunks the idea that no one rides bikes in winter. There is a drop-off, but it’s small. Even in the frozen depths of a Christchurch winter, over 800 people a day happily ride through North Hagley Park, which is only 11% lower than the year-round average. Obviously people are a bit more resistant to the cold than some like to think.
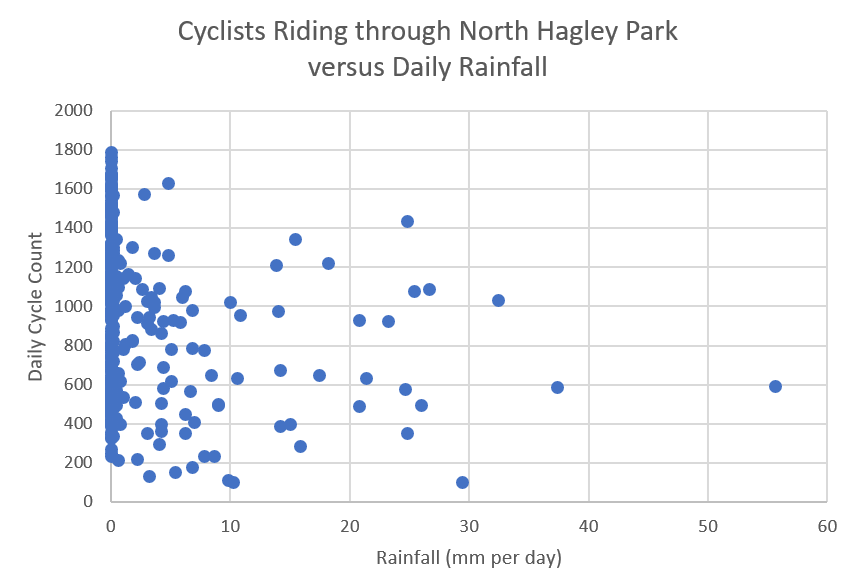
Another thing I looked at is how much cycle numbers change on rainy days. I obtained the daily rainfall data for 2018 from NIWA, and plotted the number of cyclists versus the mm of rainfall for each day. Each dot represents one day.
This shows that there’s not really much of a correlation between rainfall and number of people riding bikes. Even on the wettest day of the year (which was 20th February), 600 people still rode through North Hagley Park. This is less than the annual average of 931 cyclists per day, but still quite a few more than none.
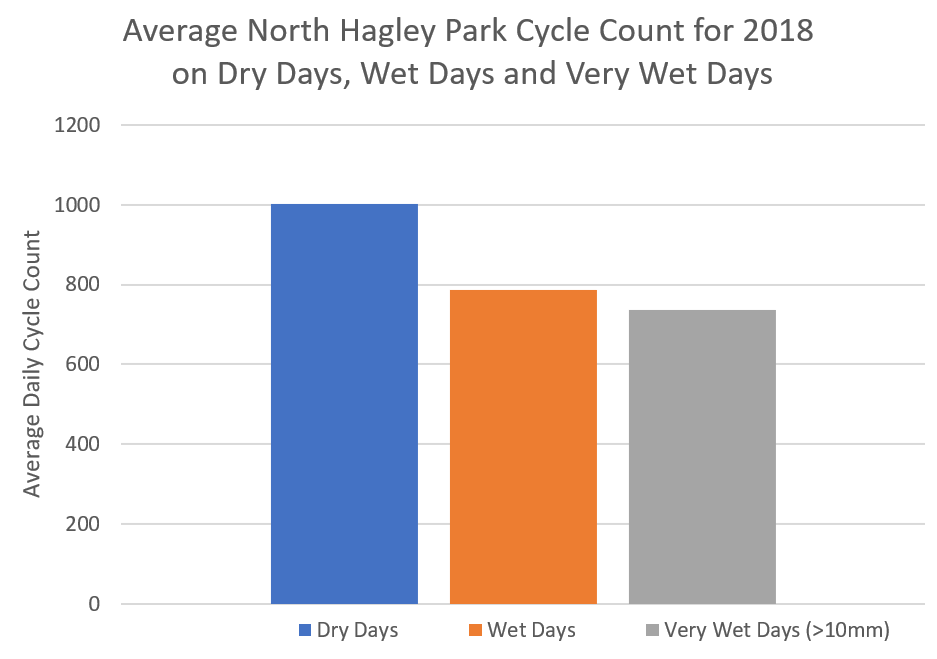
I took this same data and graphed the average number of cyclists for dry days, wet days, and very wet days (over 10mm rain). In 2018 there were 245 dry days and 120 wet days, of which 26 were really wet (>10mm rain).
The graph shows that on a dry day about 1,000 people on average ride through North Hagley Park (7% higher than the year round average of 931), on a wet day this drops to just under 800 on average (14% lower), and on a very wet day it drops further to about 750 (19% lower).
Overall the conclusion is the same – rainy days do deter some people from riding bikes, but the drop off is relatively small, with the majority of people continuing to ride regardless of wet weather.
Do you ride through winter? How about really rainy days? Why or why not?

It will be interesting to see what this winter’s numbers are like – given that cyclist numbers are on the increase, I think, and as more cycleways go in I’d expect numbers to keep rising. I bike as much as I can and am still working out how to stay driest on a bike.
I would add that there is considerable incentive to bike on wet days because the traffic congestion always seems to be much worse than on dry days. I’d love to know if there are normal traffic counts that might support that idea.
What would be really intereseting is to look at when the rain actually fell – I suspect that heavy rain in the morning would be more discouraging than the prospect of rain later…. I know from my latter commuting days this is how i behaved. Get in touch with me if you ant me to try an analyse this further.
Hi Chris. I did think that more granulated rain data would be interesting to look at. I have read somewhere once that early morning rain is the only rain that matters when people are choosing whether they bike or not, but I can’t find the article now. I’d be keen for you to do more analysis if you want – email me on chrismorahan (at) hotmail dot com
I recently visited Minneapolis which has an amazing network of cycleway’s in and around the city, most of them separate from roads. The winter there is harsh with deep snow and -30 C lows. I asked if people still cycle in the winter and the answer was an emphatic yes, they even run small snow plows down the cycleway’s to keep them clear!