
You will recall last year that the results of the 2023 Census came out with some interesting (and mostly positive) findings for transport patterns around the country and in Christchurch. While Statistics NZ has some online data tools for delving into the information, they can be a bit clunky to find your way around, especially for digging out breakdowns of transport info.
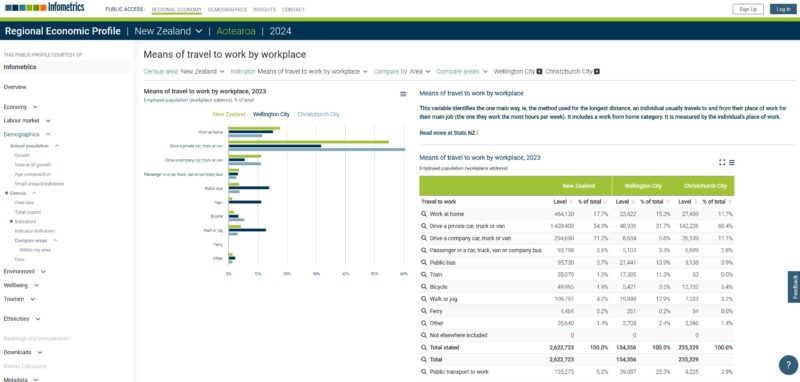
One online tool I discovered recently that is quite useful is Infometrics’ Regional Economic Profile, which allows you to quickly slice and dice different data sets of interest. With this tool you can select the measure of interest, choose a Census area (hint: start with selecting the dropdown in the blue row at the top), and see what numbers it gives you. Very handy for quick checks of data or comparisons by area or time.
The other tool I want to highlight for you today is called Commuter Waka, an online graphical app for looking at Census data. Commuter Waka was originally developed back in 2020 by Jono Cooper (who won an award for it…) based initially on the 2018 Census data, and now also capturing the 2023 data.
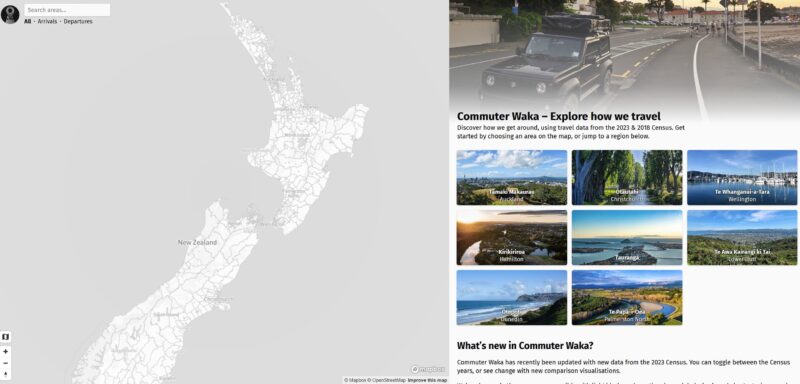
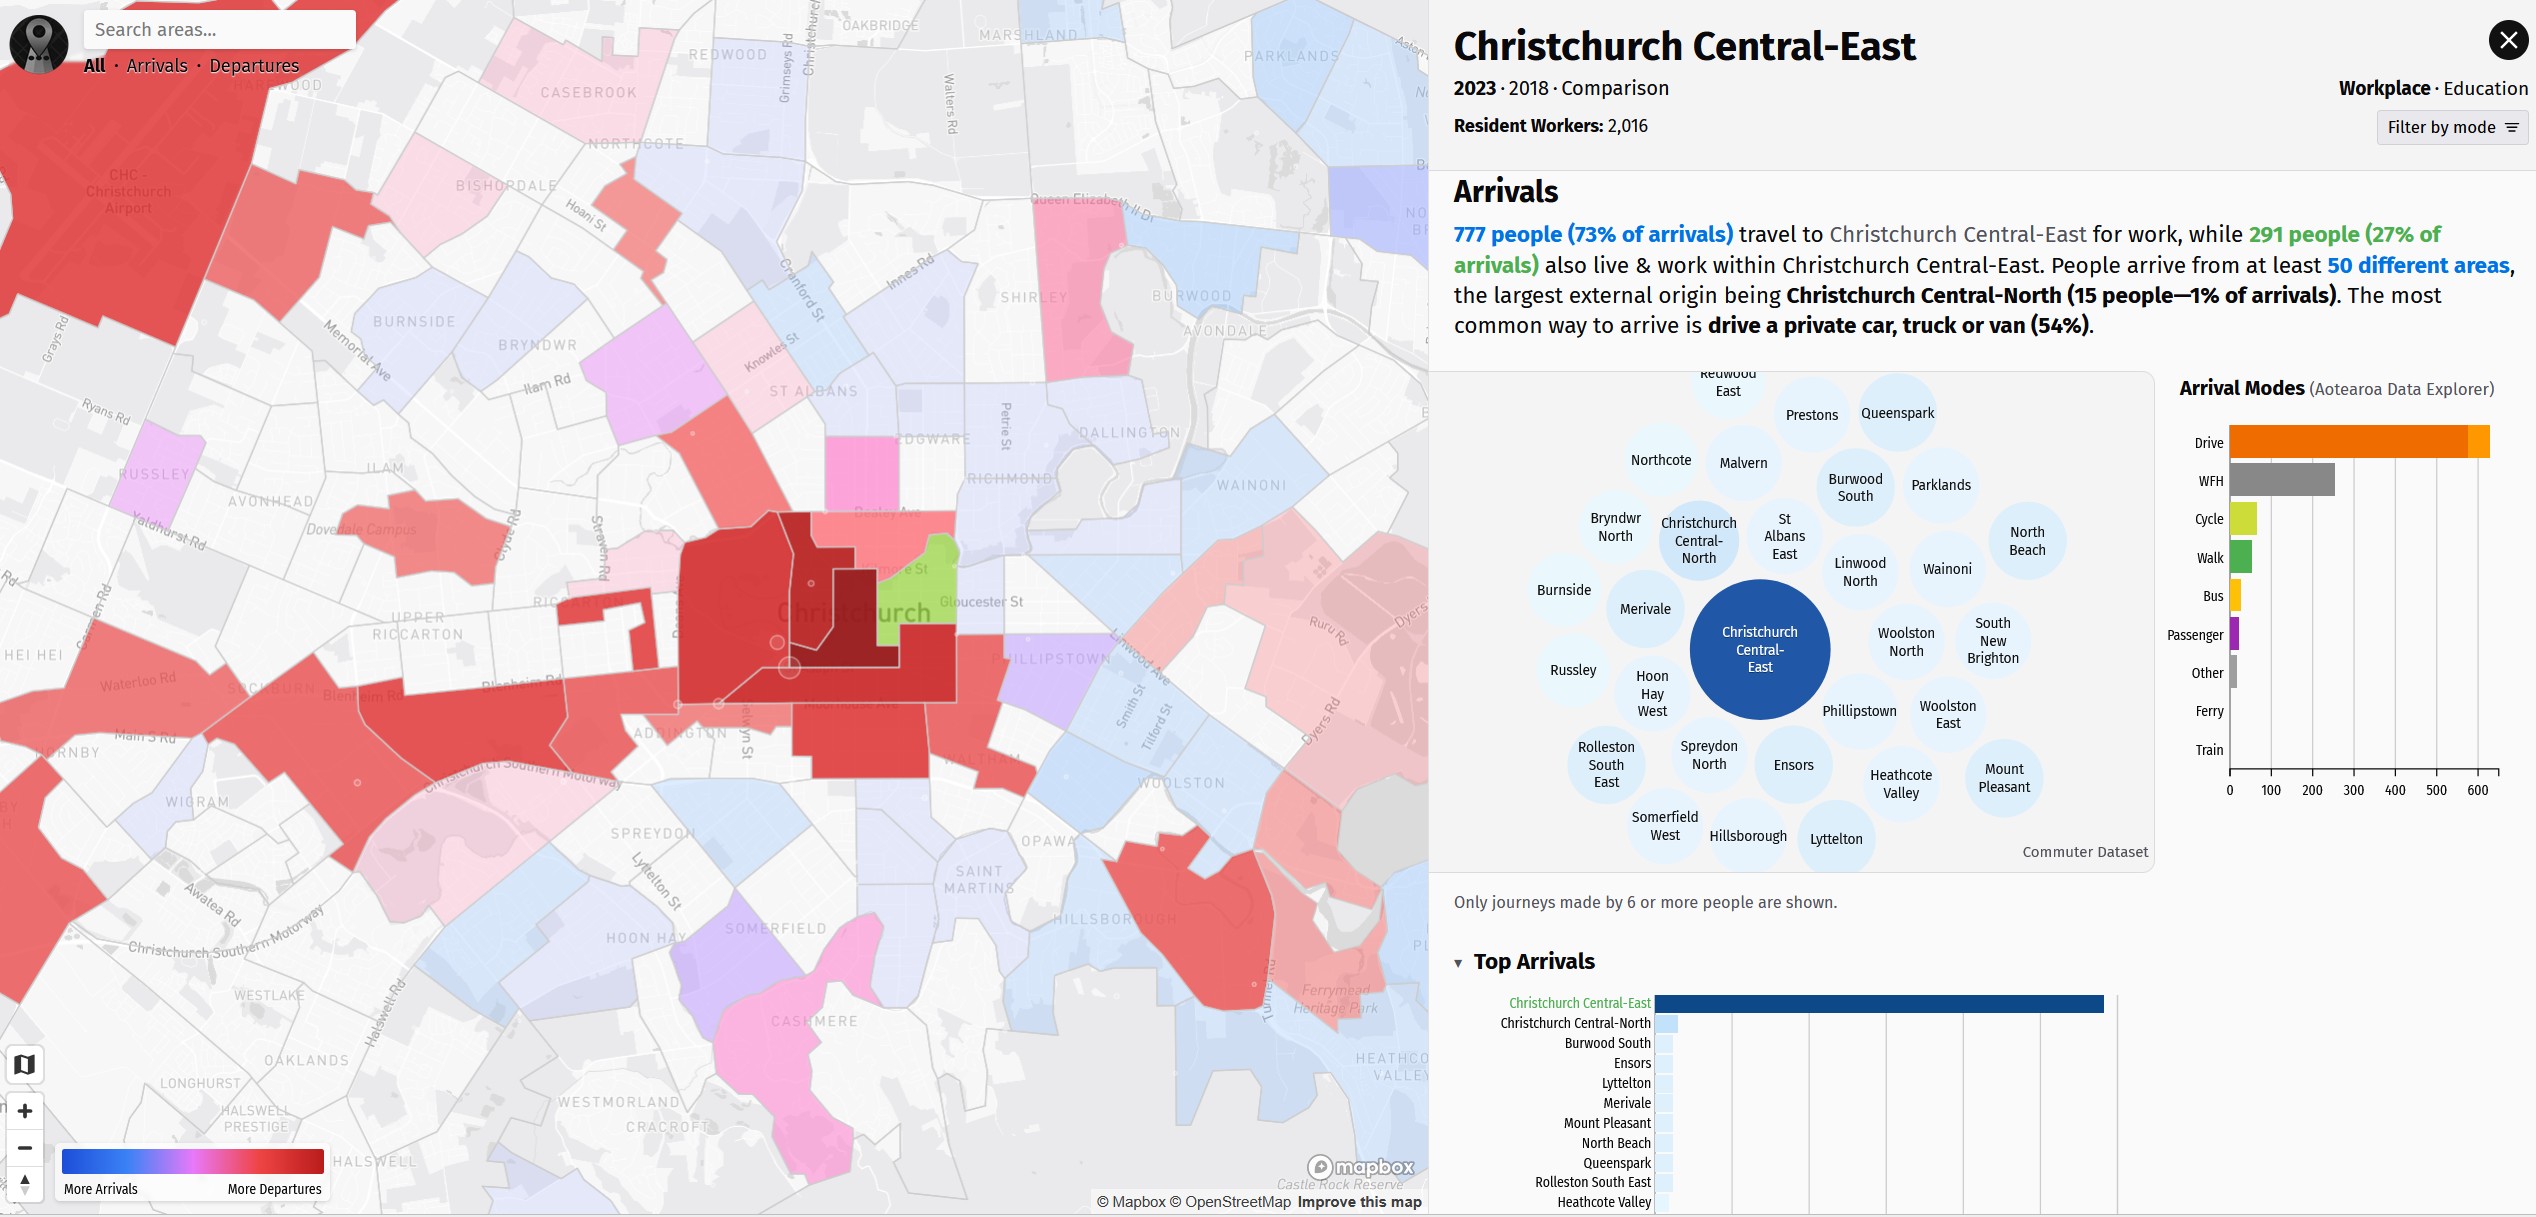
As well as focusing specifically on the journeys to work and education data, one of the useful aspects of this tool is ability to easily zero in on particular geographic areas to understand the travel patterns there. While this can apply to anywhere in NZ, it means that we can get some useful information about how we travel around Ōtautahi Christchurch, including between suburbs. Just click on a particular statistical area (highlighted in green) and you’ll get information about where people are coming from or going to and by which mode. I was a bit intrigued though that my usual journey to work from Waltham to Chch Central East didn’t appear to be picked up at all – hmm…
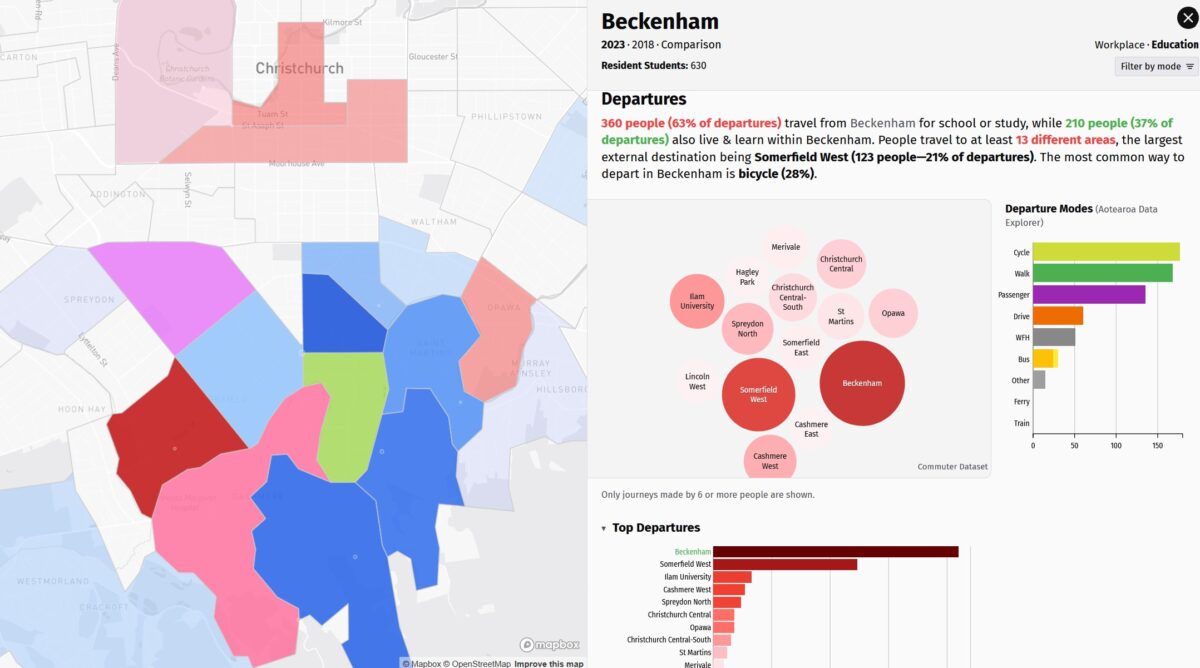
Looking around the city helps to highlight the high and low cycling spots. For example, we know that Beckenham scores highly for cycle work commuting, with 20% of people biking (if we exclude people working from home, it’s actually more like 25% of those travelling…). And cycling comes out tops there when we look at commuting to places of education/study – a whopping 28% of people bike from there.

Another interesting exercise is to compare between the 2018 and 2023 Census figures, using the ‘Comparison’ option up the top. Are more or fewer people now travelling to an area, and what modes are they using? Useful to consider for the areas where new cycleways have been built…
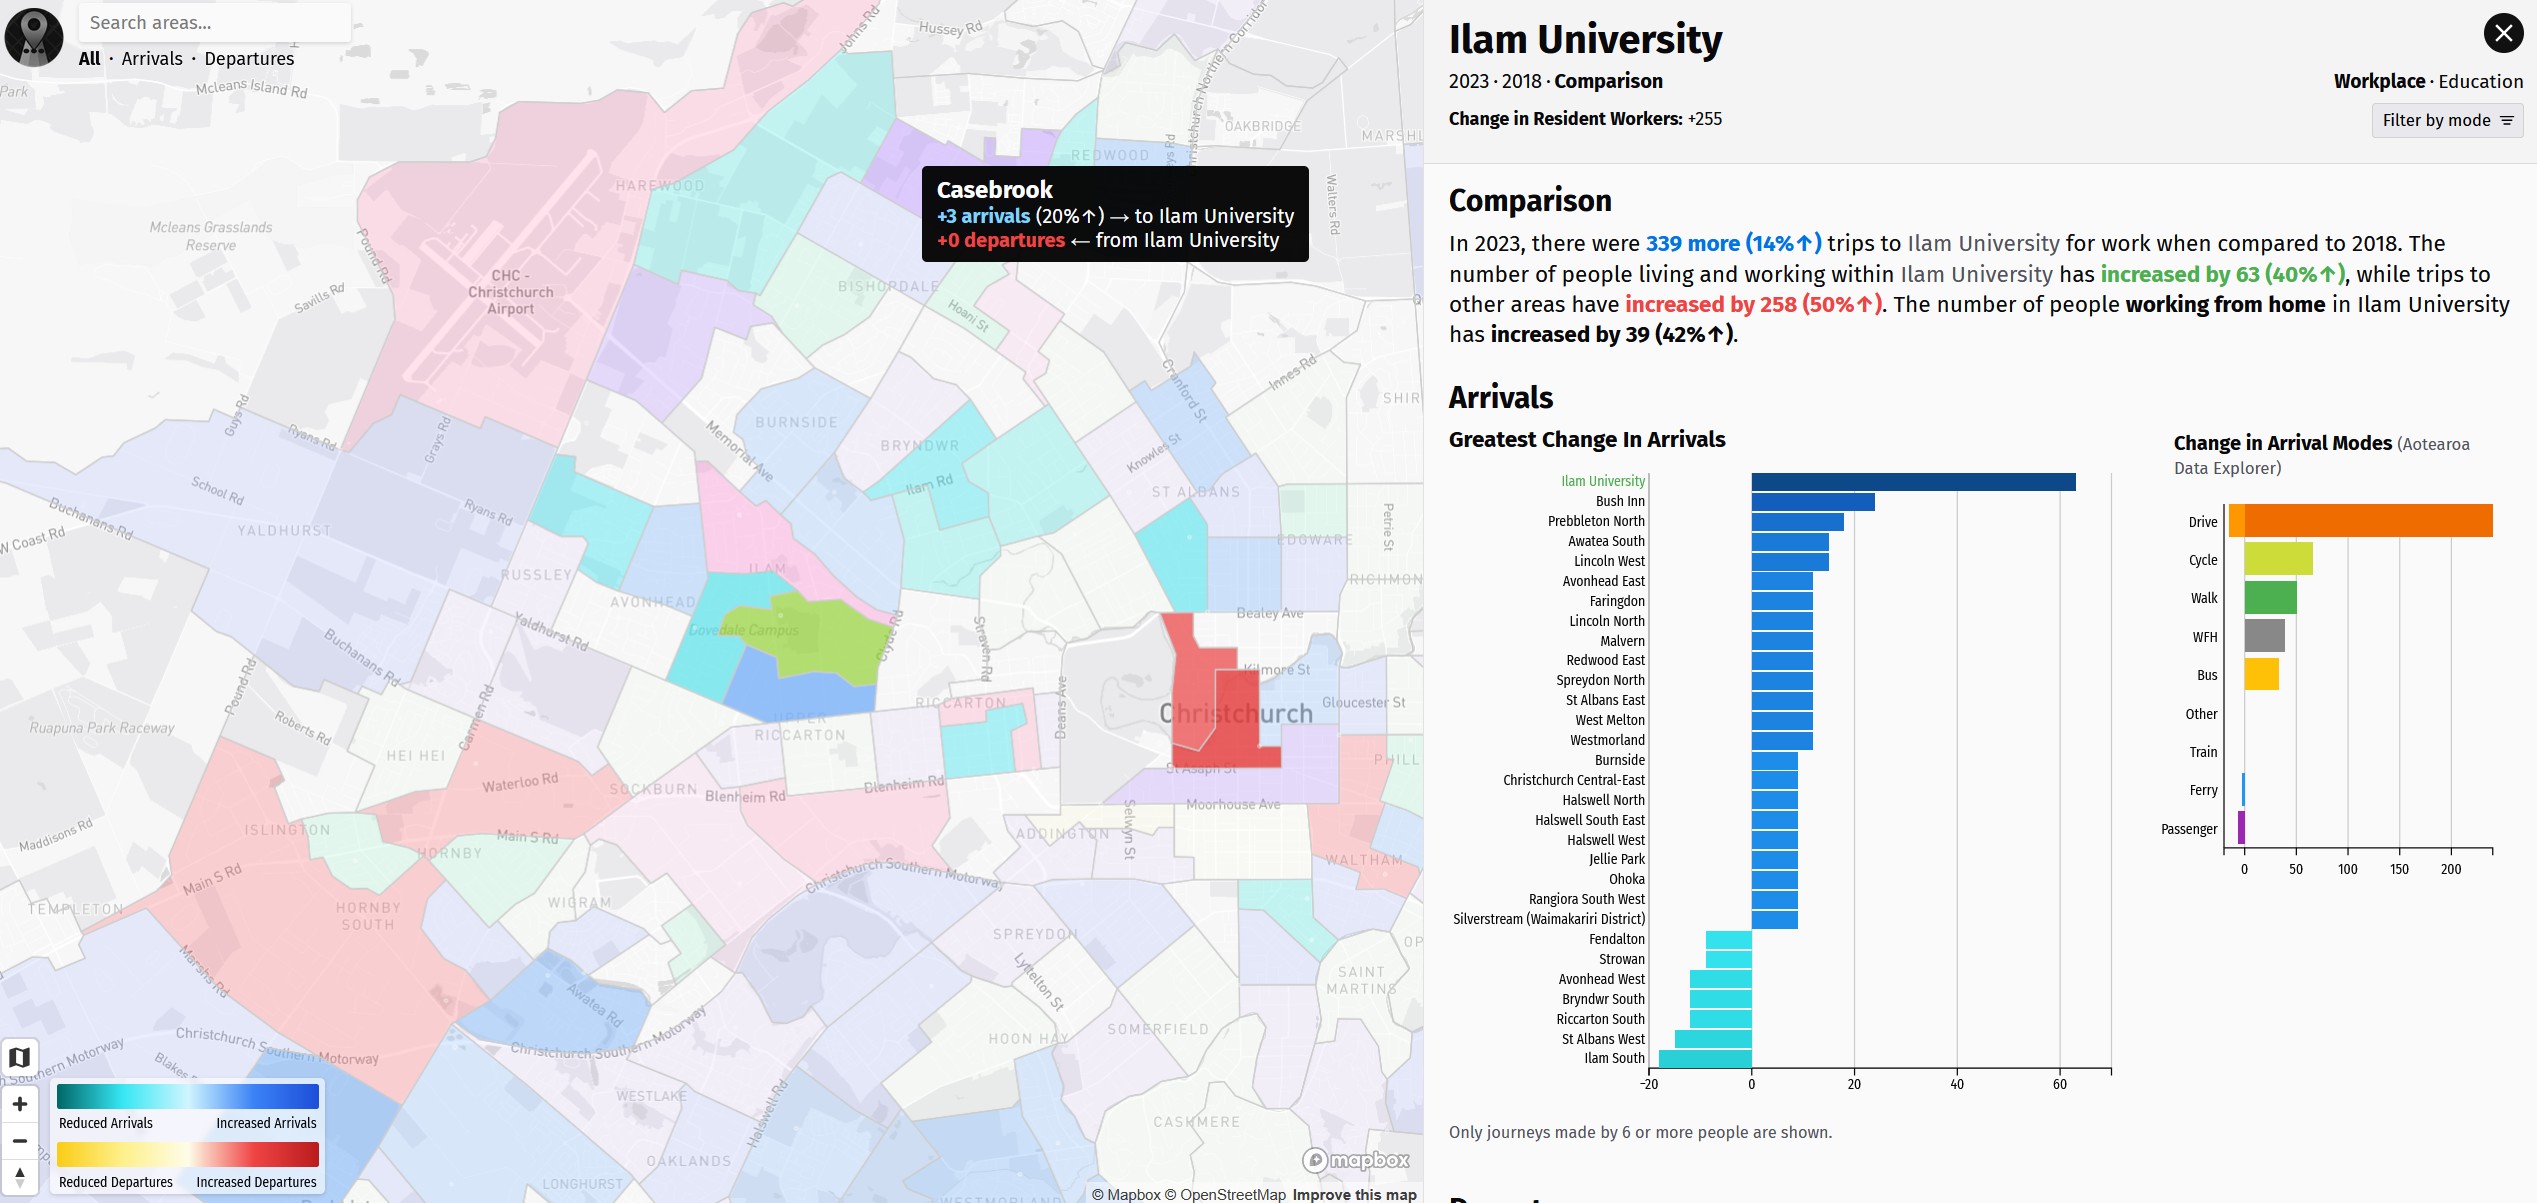
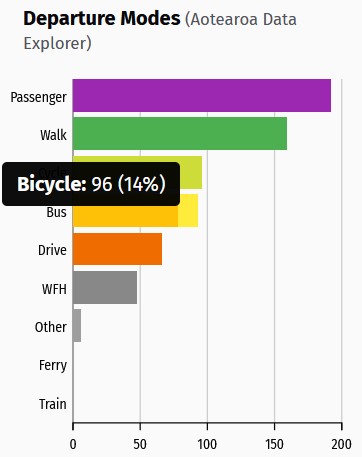 You can have more fun hovering over or clicking on different modes and suburbs to see what the underlying numbers and percentages are. You can even use the ‘Filter by Mode’ dropdown to look at just particular travel modes, and you can also filter by just Arrivals or Departures.
All in all, Commuter Waka is a very useful resource when trying to understand travel patterns in Christchurch and beyond.
Have you tried Commuter Waka? What do you think of it?