
About 18 months ago, the 2023 Census was undertaken, asking everyone in NZ various details about their households and work/life habits. I’m not entirely sure why it takes so long to collate the relevant information from what is now largely an electronic data collection exercise, but finally in the past few weeks we have started to see so useful information from it about how we travel to work and study – and it’s pretty good news cycling-wise in Christchurch…
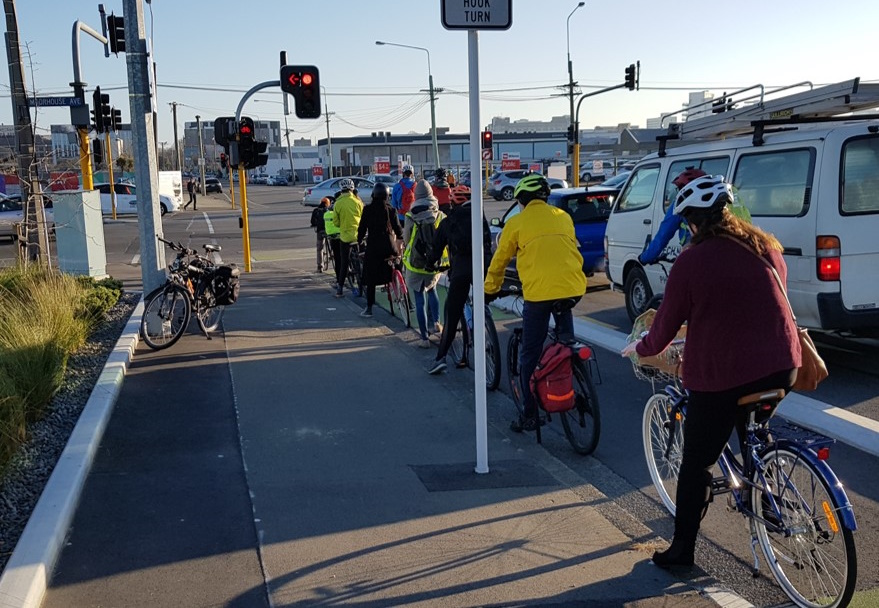
There’s a lot more of this happening in Christchurch…
As you may recall, two of the relevant questions asked are “what is the main means of travel that you usually to travel to work?” and a similar question for travel to study. Back in 2019, we discussed some of the potential problems with this type of question in getting a useful picture of travel. Nevertheless, it is what it is, so we have to work with it.
One of the interesting trends nationally since the previous Census, no doubt influenced by Covid lockdowns, is the rise of people working and studying from home. Nationally, the proportion of people now usually working from home instead of commuting has risen from 12% to 18%, with places like Auckland and Wellington more than doubling their numbers. The figure is not quite as pronounced in Christchurch, having gone from about 9% in 2018 to 13% this time, but that certainly has had an impact on travel across all modes. While it’s an interesting statistical quirk, for the sake of the stats here I’m going to talk about the numbers and proportions of people who are actually commuting rather than staying put.
In that respect, the good news is that Christchurch is seeing some strong gains in cycling numbers, mirroring what we have seen elsewhere in general growth around the city. In terms of commuting to work, the numbers who regularly do this by bike have climbed nearly 14%, from 11,160 a day in 2018 to 12,690 in 2023. As a proportion of people travelling to work, that has lifted the numbers from 6.2% of travellers to 6.9% now.
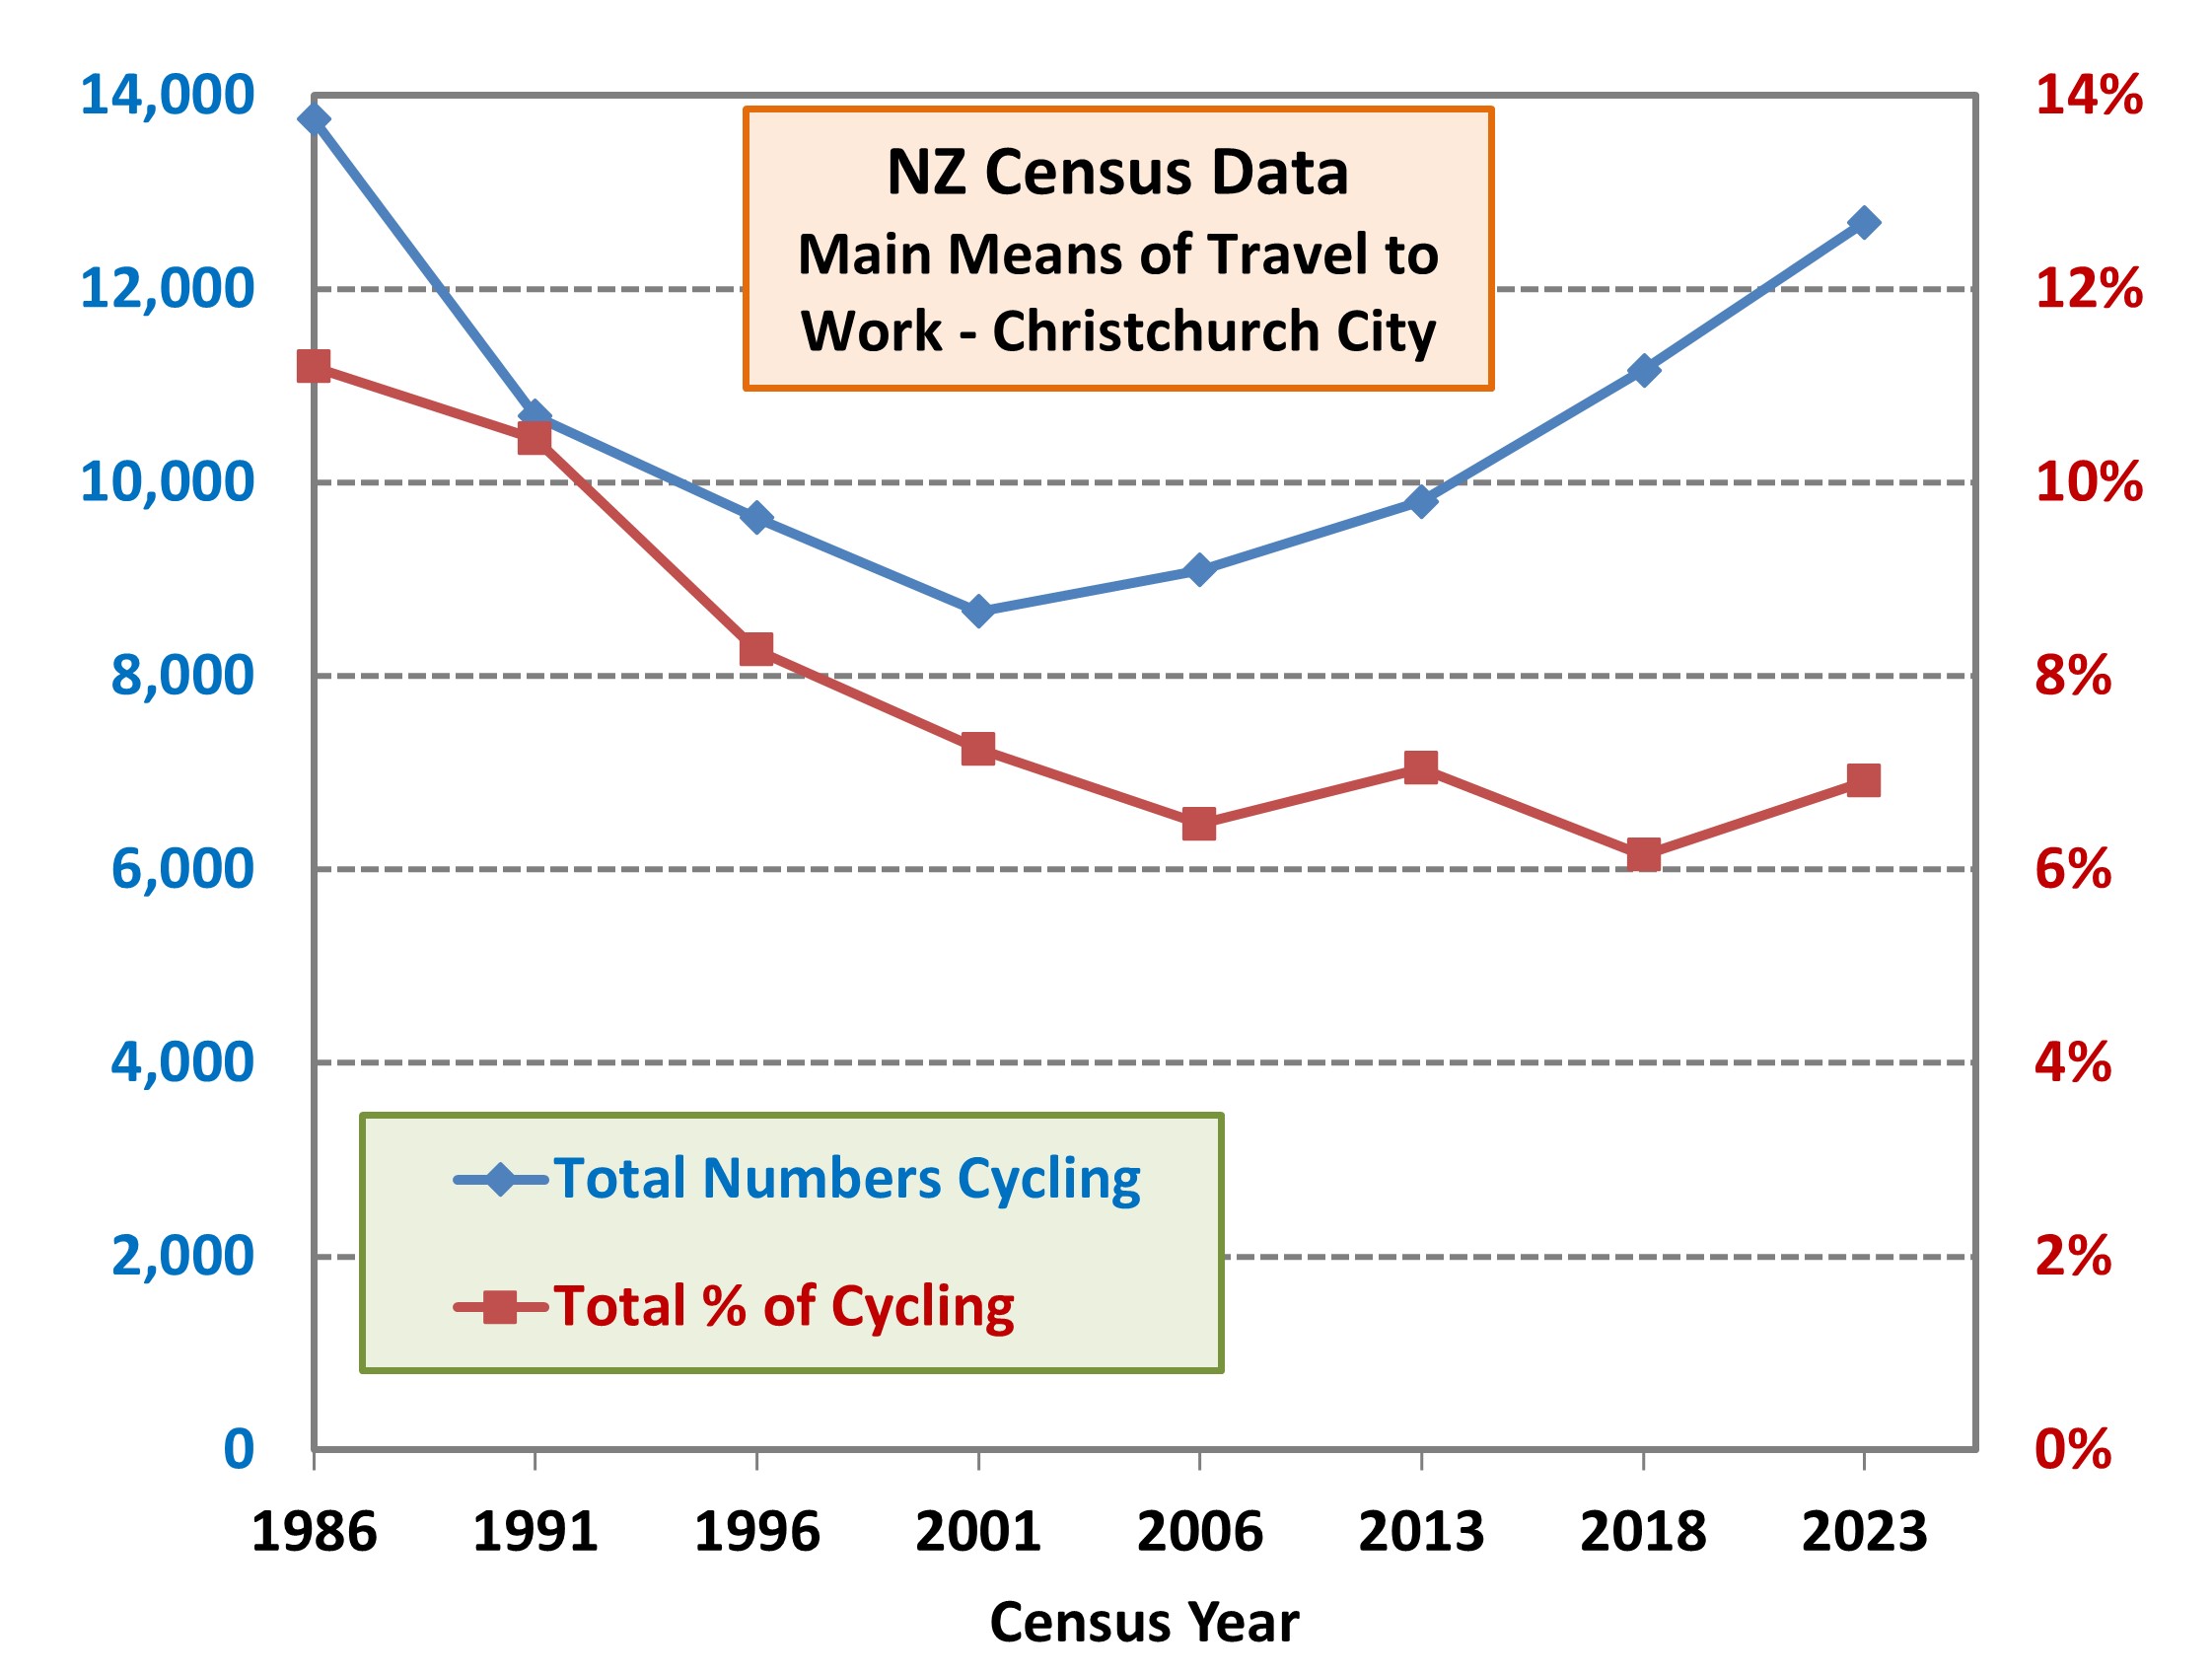
Cycling to school/training institutions for study has also increased in Christchurch, up 11% from 8199 a day in 2018 to 9090 in 2023, which is over 10% of people who travel to study by bike. Collectively that means well over 21,000 people a day are now cycling to work or study in Christchurch – a very encouraging trend.
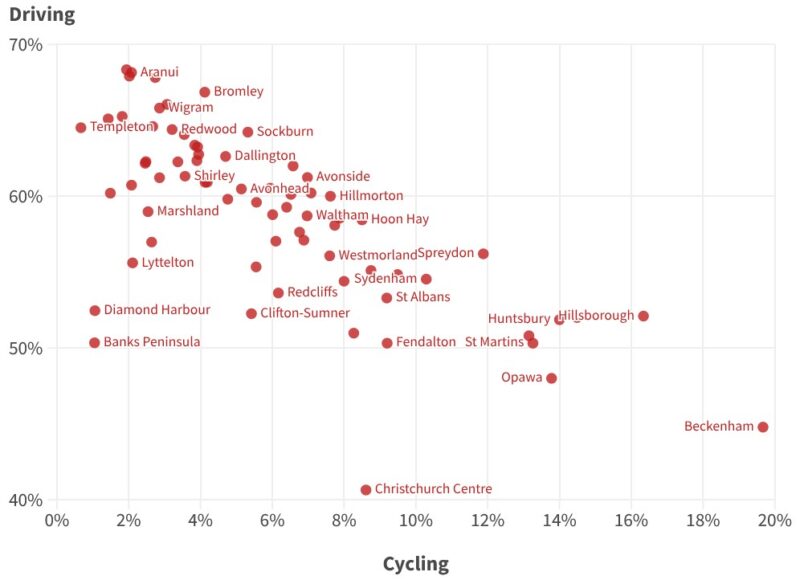
Zeroing in on which suburbs in particular are seeing good cycling numbers and the southern suburbs continue to dominate the stats. In some cases, we are talking about one in five or six commuting trips being made by bikes. While that’s partly a consequence of demographics, a big contributor no doubt has been the rollout of several cycleways in this area, including the Quarrymans Trail and Heathcote Expressway. As I alluded to back in March, the biggest gains in cycle counter numbers have also occurred in the areas where cycleways are being connected. Contrast that with some of the northwestern and northeastern areas where a lack of good cycling connections has stymied potential further growth for now (Wheels to Wings anyone?)…
What do you think of the latest Census cycling figures?
“As you may recall, two of the relevant questions asked are “what is the main means of travel that you usually to travel to work?””
Exactly, my wife put usually drive even though on average she bikes around 40% of the time . It’s a badly worded question and she commented on it when we went through our census together.
What’s interesting is some of these suburbs around 50% of people are driving to work, which means the other 50% is walking, cycling, taking public transport to work. All great wins!
Since the pandemic, there’s a lot more “Work From Home” which should have it’s own category now.
There is actually a separate “work/study from home” category in the Census data and some people have included it in the reported stats (which makes all the other percentages lower). I have chosen to only focus on the mix of people who actually travel to work or study.
Small nitpick – I think you should credit The Press in the caption of the “Top cycling suburbs in Christchurch” chart. The chart also does not clearly display all suburbs – quite a few are just dots (with no label) that are barely visible. Would be cool to see a chart which fixed this.
This chart shows that 9 suburbs have more than 10% of people cycling as their main way to get to work and another 15 suburbs are close behind at between 7%-10%.
At least 50% of my trips are done by bike and many weeks I would do over 50km, but this does not appear in the census data. Now I am retired I no longer feature in these statistics sadly. The Press top cycling suburbs is very interesting. It would be nice to see a driving vs public transport version for the ECAN submission.