Last week, the Chch City Council released the latest cycle count stats showing that cycling numbers in the city are continuing to climb, up 6% from the same time last year and 30-40% up since 5+ years ago. As the mantra says, “if you build it, they will come…”
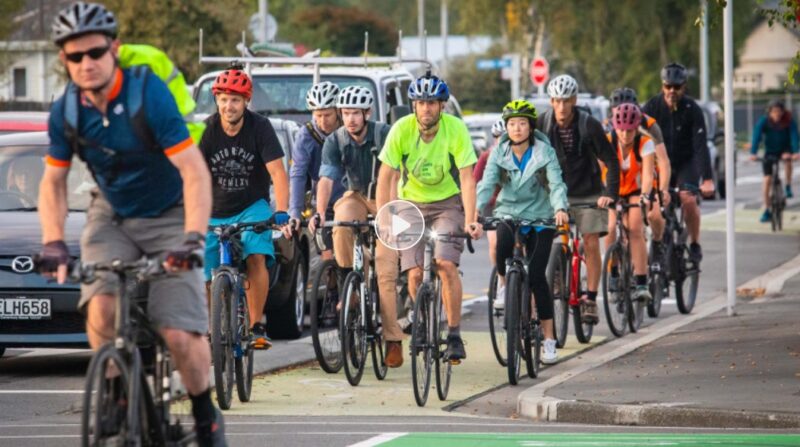
Not surprisingly, the usual curmudgeons were out on social media deriding it as “fake news” and wondering where all these people cycling were, because “they never see anyone biking”. It’s good to see a growing number of people pushing back and saying how great it is to see more people cycling (including themselves).

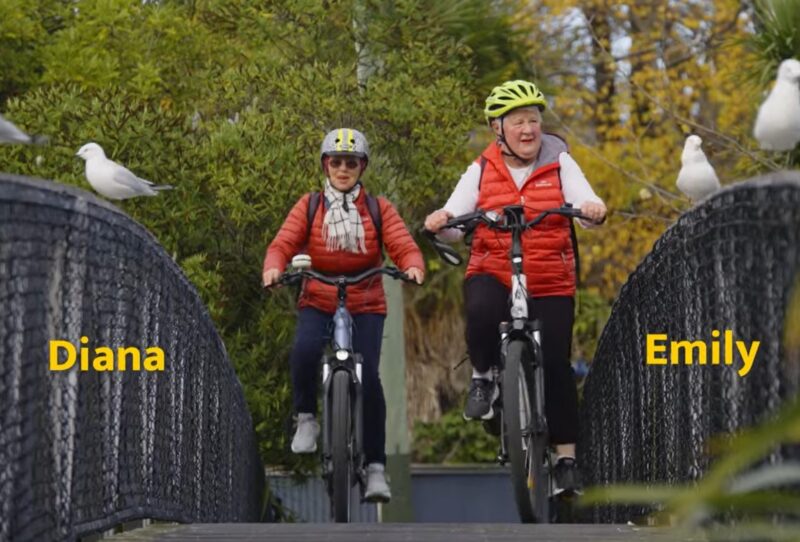
It continues a good week for nice cycling news in the city, hot on the heels of an excellent new short video from Frank Films, “Back to the Cyclopolis”, charting the rise (and previous fall) of cycling, particularly following the earthquakes of a decade ago (a nice write-up about it in Stuff as well). The film follows a few different locals (including my own colleague John Lieswyn and his dog Indy) as they show how cycling has really returned with a vengeance in our fair city.
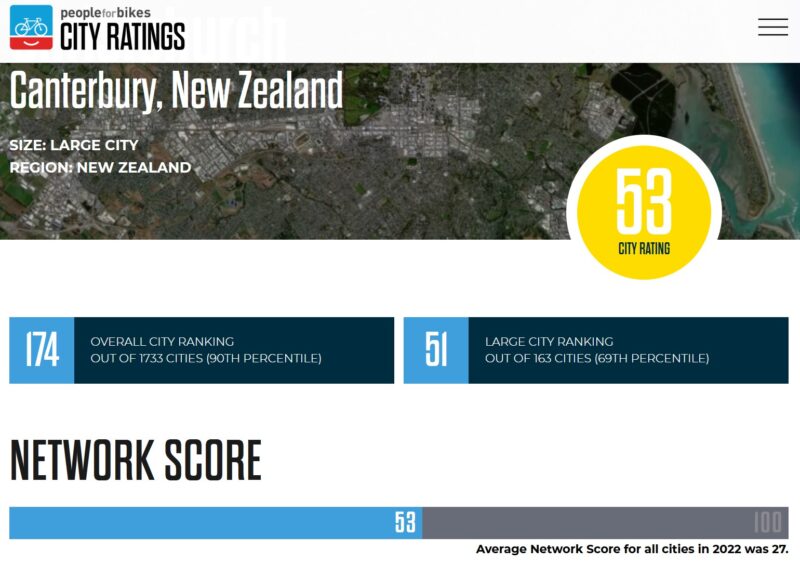
If that wasn’t enough, US advocacy group People for Bikes (PfB) recently released their 2023 City Bike Ratings. I’ve grumbled in the past how New Zealand (let alone Christchurch) doesn’t even feature in many of these international “ranking” measures we see publicised. So, imagine my pleasant surprise to find that this year Christchurch has been included among the 1733 cities around the world that were evaluated (even if, bizarrely, we are grouped under “Europe” alongside the likes of São Paulo and Ho Chi Minh City…) – and we rated in the top 10% of cities rated, and 51st among the “large cities” (>300,000 population) with a score of 53/100 (the top city, The Hague, had a score of 89/100).
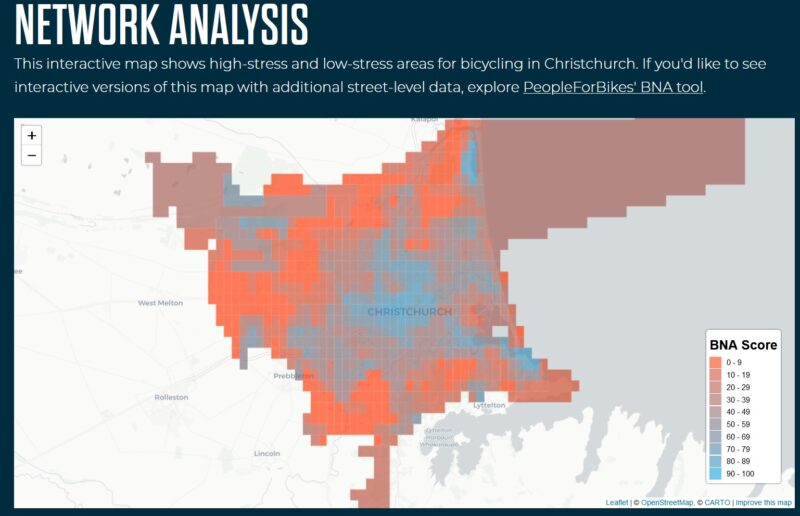
Now I have to admit that it’s possible I may have been the instigator of this new ranking, as PfB allows any city to put their hand up to be ranked by filling in some details, which I duly did after last year. PfB uses an interesting set of metrics to determine the relative scores, basing a lot of information on what is captured in OpenStreet Map (which in Chch’s case, fortunately captures a lot of cycleways).
PfB’s city ratings are a little bit odd in the way that they rank local government areas rather than urban areas (for example, over 300 of the rated “cities” don’t even have 10,000 people, including 5 in the “top 20”). So a place like Melbourne Australia, for example, is split into its constituent councils. One of those, Yarra, is rated the top Australasian city at 111th with a score of 60/100; Canberra also just sneaks ahead of Chch at 171st (53/100). They’re both pretty good when it comes to cycling provision – better than Christchurch? Let the debate continue…

There is a lot of potential to improve what is recorded by PfB in their database. One metric used is “Safe Speeds” for example; given the fact that Chch City has just approved a swathe of lower speed limits around the city, that could bode well for the ranking next year. Maybe with a continuous improvement in this ranking, Christchurch cycling really can continue to be on the up…
Do you think cycling in Christchurch has improved over the past decade?

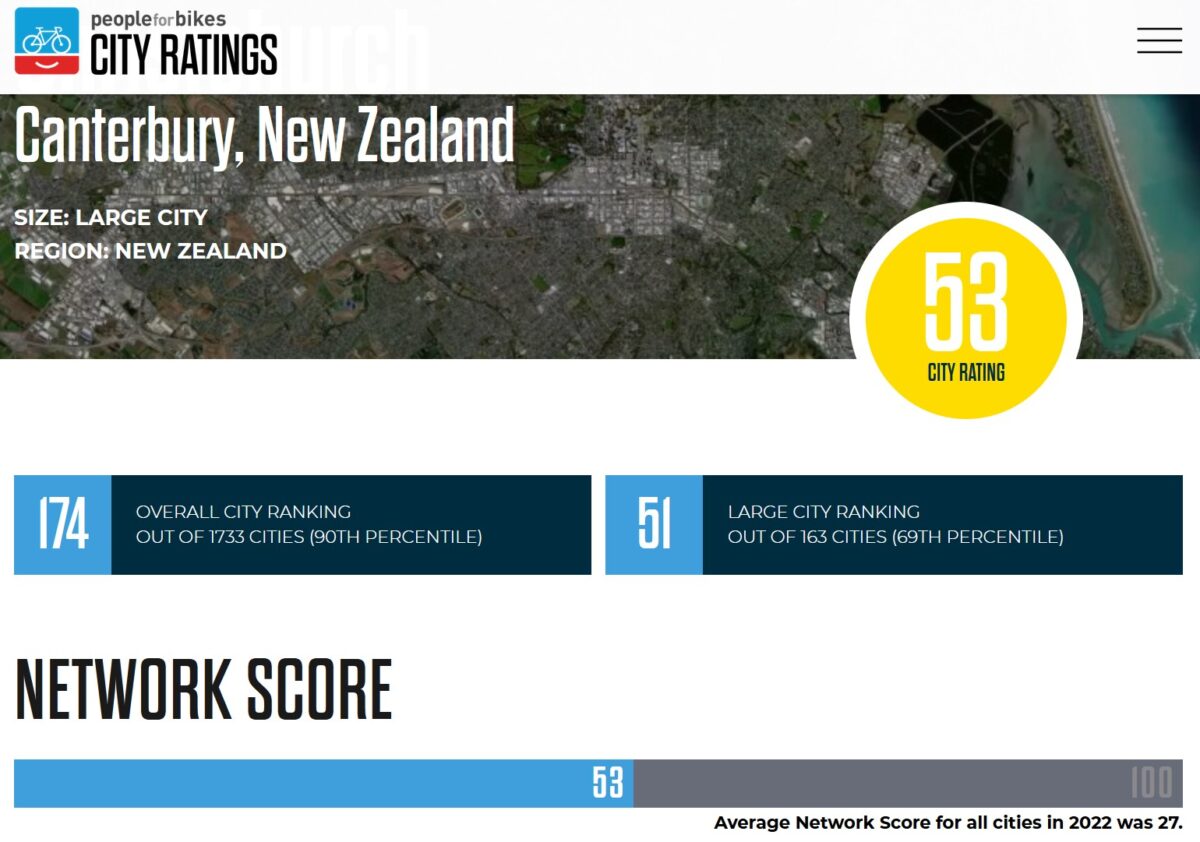
The PfB data sourced from OSM appears to be reasonably stale. I’d almost say it appears to be from pre-2020. This will skew the scores lower as OSM has been significantly updated since then, including in the past months some major updates.
What percentage per population cycle in christchurch on a daily basis
There’s a separate post that answers that question: short answer is that over 20% of people cycle at least once a week in Chch (many of them will be regular daily riders) – https://cyclingchristchurch.co.nz/2023/06/13/more-people-than-you-think-in-christchurch-are-cycling-and-a-growing-number-are-female/