There’s a brand new blogsite, Talking Transport, dedicated to all things transport around Christchurch. We’re looking forward to seeing some really interesting conversations there! Here’s a recent article posted there by website creator Chris:
My colleague came back from a nationwide walking and cycling conference a few weeks back and said something I found intriguing. He was describing a talk someone gave where they said something to the effect of “we’re building a lot of cycling infrastructure, but we do need to keep in mind that cycling infrastructure is mainly just for rich people – poor people don’t cycle”.
I found this odd because it’s not the first time I’ve heard it said. I have vague recollections of hearing this previously and instantly dismissing it because it jars so abruptly with my own personal experience – cycling is the cheapest way to get around so surely it’s perfect for poor people. I know as an income-less student it was the only option I had. But this was not the Stuff comments section – this was a conference of recognised experts who tend to know what they are talking about, so I decided to have a closer look at whether this is true or not.
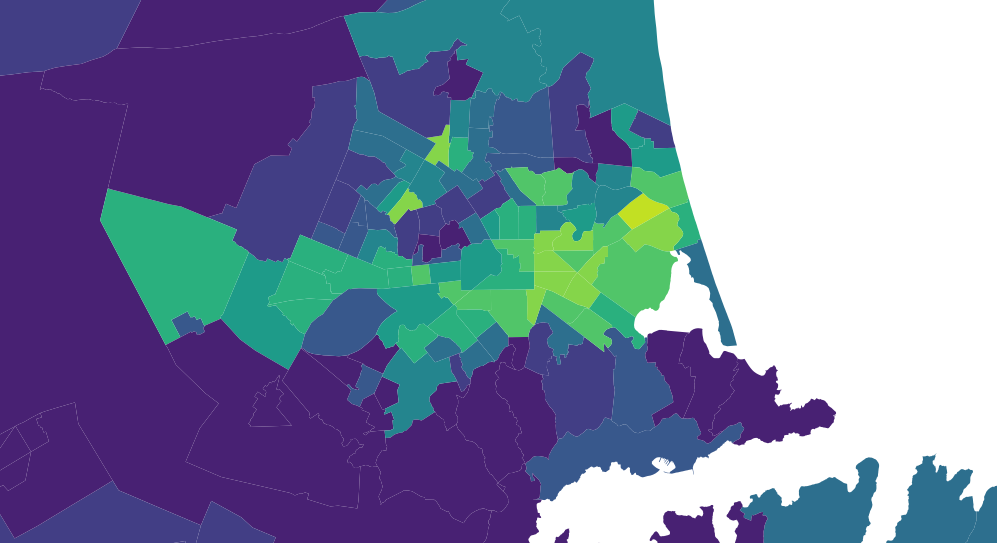
I had a look at Census 2013 data (it would be great to use 2018 data, but this is not available yet). First I mapped each area of Christchurch by deprivation index (a nationally recognised way of measuring who’s rich and who’s poor).

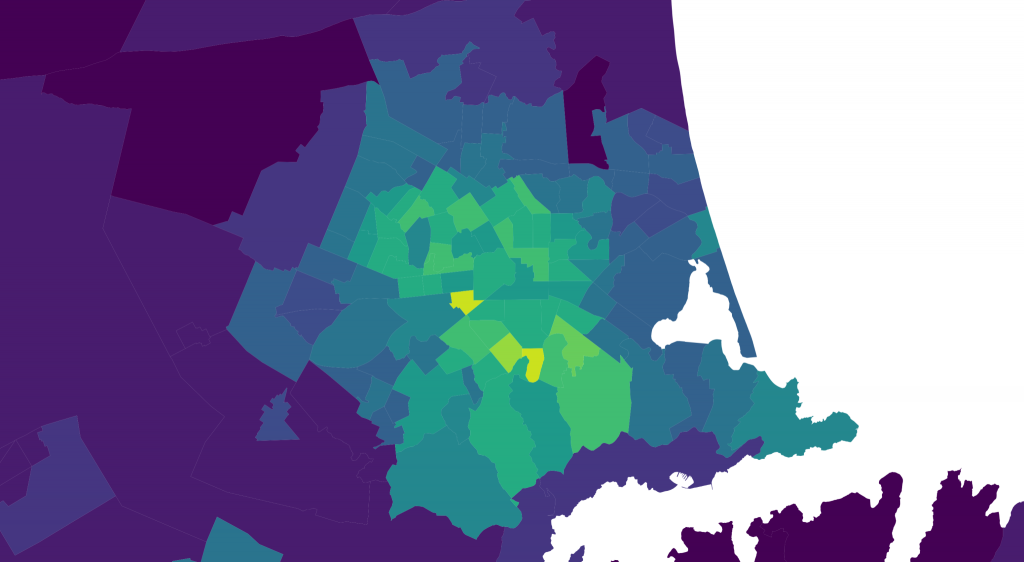
Next I mapped each area of Christchurch by the percentage that cycled to work that day.

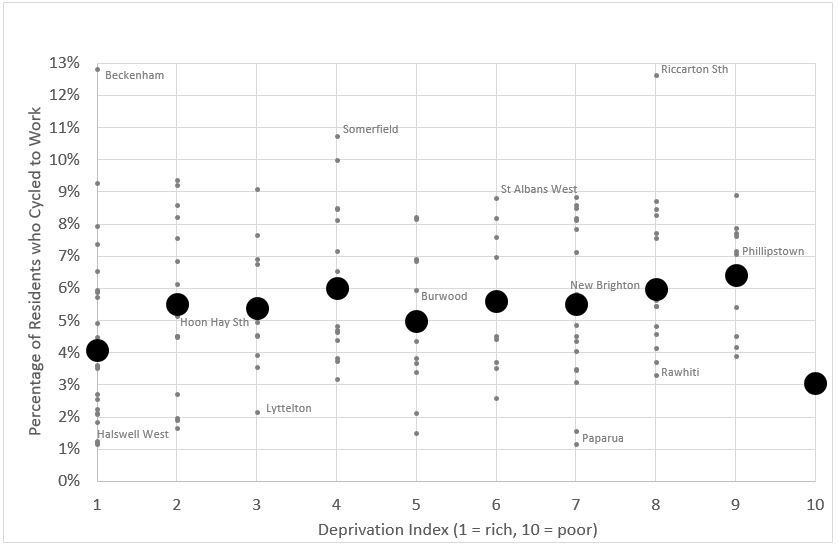
It’s a bit difficult to really see any trends here, so I tried graphing them instead. Deprivation Index is along the horizontal axis, percentage of people cycling is on the vertical axis. Each small dot is a suburb (“area unit”), the large dot is the average value for all suburbs with that deprivation score. I’ve put a random selection of suburb names on just to give a bit of context.

Now the trends are a bit easier to see. Firstly, it shows that for each deprivation index, there is a broad range in the percentage of people who cycle to work. Secondly it shows that people from rich suburbs are not cycling any more than people from poor suburbs. If anything there may be a slight trend the opposite way – the poorer suburbs of Christchurch tend to have slightly more people cycling to work than the rich suburbs.
This is the opposite of the claim that “cycling infrastructure is mainly for rich people”. This doesn’t mean the claim is untrue – just that it is untrue in Christchurch.
I think this can be mostly explained by Christchurch’s unique real estate situation. The argument that only rich people cycle is related to the idea that only rich people can afford to live close enough in to the city to be within cycling distance – poor people have to live in the cheaper areas further out of the city where it’s too far away to cycle. In Christchurch however this isn’t the case. Many of the inner city suburbs are cheaper to buy/rent houses in than outer suburbs. The deprivation index above roughly shows a large donut of rich purple areas, surrounding an inner city of poorer inner suburbs. This is the opposite of what most cities have, where the closer to the CBD you are, the more you’ll have to pay for a house. I have no idea why Christchurch is like this. This pattern predates the earthquakes – they may have exacerbated it, but I don’t think they have caused it.
So in conclusion, if you ever hear the claim “cycling is just for rich people”, I think you can discount it if you’re talking about Christchurch. The data shows that both rich and poor people are cycling – if anything poor people are cycling slightly more.
If you think you know why Christchurch’s real estate is so different to a typical city, feel free to comment below, or any other thoughts on the relationship between cycling and deprivation…

This is interesting but I think there is definitely a lot more to it. For example, topography may have something to do with it – some of the higher decile areas in Christchurch are located on the hills, and I live in Lyttelton which has a low deprivation score but where few people cycle (probably mostly due to the hills and the inability to cycle through the tunnel).
In my research with adolescents, the percentage of students cycling to school was far less at low decile schools compared to high decile schools. This was partly to do with access to a functioning bicycle, and lack of cycleways but also due to the norms associated with cycling in these different neighbourhoods. Overseas research also shows social norms regarding cycling are also influenced by ethnicity and this is likely to also be a factor here too.
Yea I agree, for each index value there was a big range in biking mode share, indicating there’s other factors at work too. I would be quite interesting to dig more into some of those. Also just a note that this is based on the Census question on travelling to work so it doesn’t actually reflect children/adolescents.
I have had a few conversations with kids from a deprived background and a broken bike as a reason for not cycling came up quite often. Not owning a bike is the perfect excuse obviously, apart from the fact that I believe that most kids thoroughly enjoy cycling. Cycling is of course not only for rich people (certainly with the current fuel prices) but the barriers to own and maintain a bike for poorer people are higher than for people on high incomes. This is why I love the work that RAD (www.radbikes.co.nz/projects/projects/) is doing . The government should take Working for Families one step further and gift a free bike to all six year olds.
Great to see that you have started blogging about public transport in Chch, Chris! Change will only come with awareness and our the local media is not particularly placed to cover this topic, preferring clicks over informing the public so great to see you are taking this space!!!