This week I’m helping to teach a road safety course at Canterbury University. Road safety was also one of the considerations by City Council when determining this week which local transport projects might get the chop as a result of additional Govt “CERF” funding (more on that in another post soon). The safety of cycling is not a new topic; indeed, it’s a key driver for rolling out our major cycle routes. Nearly seven years ago I looked into what were the main cycle safety hotspots and crash factors around Chch, in a blog post from Apr 2016. It might almost be time to revisit the crash data and see what it’s currently telling us…
I’ve been involved in a few recent discussions with the City Council about current cycle safety issues in the city; it is of course an ongoing issue in the city. To help inform me, I thought I’d have a look at some recent crash data, and I figured that many readers might also be interested in this too.

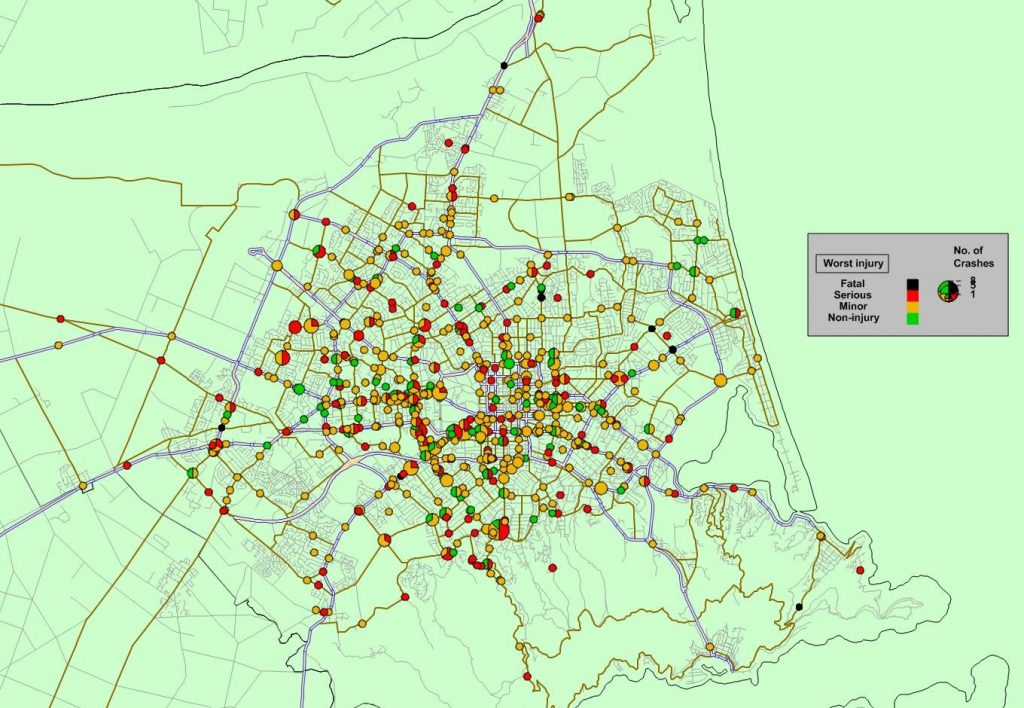
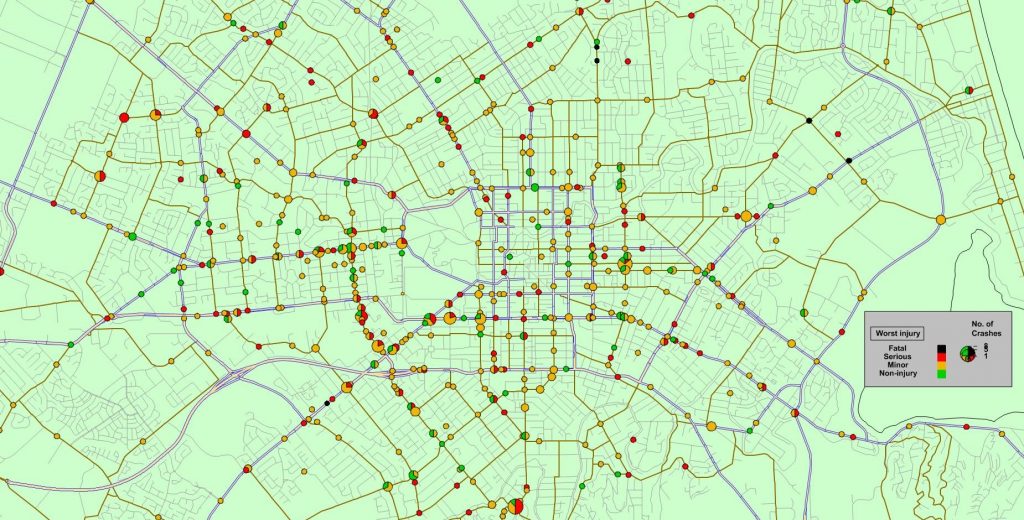
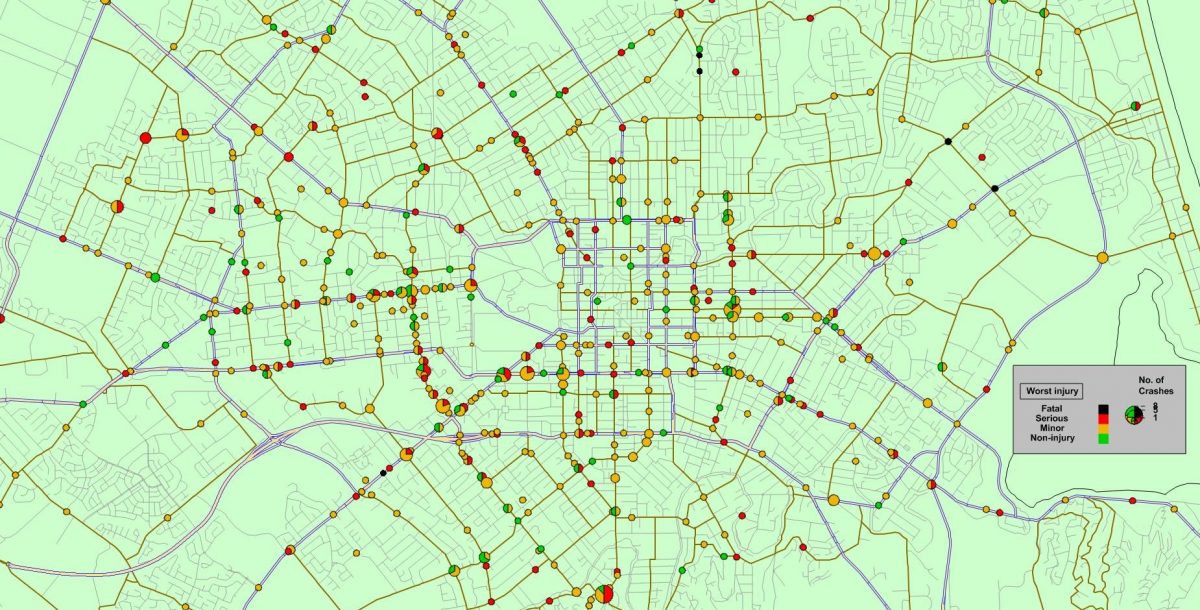
I pulled up (from the NZTA Crash Analysis System) all reported cycle crashes in Christchurch City for the five years between 2011-15 (while some 2016 crashes will be in the system, they can take 2-3 months to all appear). Over that time, 749 cycle crashes have been reported here (including 8 fatalities); the figures produced here show them coloured-coded according to their severities (a “serious” injury usually means hospitalisation), with larger circles representing locations where multiple crashes have occurred.
749 might sound like a lot of crashes; that works out to one every 2.4 days over this period. However our travel data tells us that over the same period there were approximately 90 million cycle trips made across the city. So that is roughly one reported crash for every 120,000 trips made – not so bad odds. We have to accept however that many cycle crashes are not reported to the authorities (especially lesser/no-injury crashes or those not involving a motor vehicle), and that’s not even considering the “near misses” that many people encounter too. So the actual crash rates observed by those on the road are generally worse again; my own personal experience (2 non-injury collisions in 15 years of cycling here) bears out a higher typical “hit rate” than the official stats. If you want to improve the quality of the data we have to work with, report that crash!
There are two ways that we can tackle the cycle safety problem:
(1) Identify locations where there are a high number of crashes and identify some treatments (usually physical works) to improve that location.
(2) Identify common crash factors/behaviours that are prevalent across a wide number of crashes around the city and identify some treatments (usually education or promotional) to improve that particular issue.
Considering the first approach, there are some clear problem spots that seem worthy of attention, and perhaps not where you might expect. Which location has the highest number of reported crashes in five years? That dubious honour goes to the Colombo/Centaurus/Cashmere/Dyers Pass roundabout with 8 crashes (including 4 serious ones). The Stanmore Rd / Hereford St roundabout is next (7 crashes), followed by two sites each on Whiteleigh Ave and Moorhouse Ave with 5 crashes apiece.

Whiteleigh Ave in fact features quite strongly as a problem corridor stretching from Barrington St all the way through to Straven Rd. Post-quake this route saw notable increases in both cycle and motor vehicle numbers, and the central part along Clarence St has no cycle facilities to speak of. The eastern end of Riccarton Rd also has a high crash rate; fortunately that is being addressed by the bus priority works along there. It is perhaps not surprising that many of the highest crash corridors are popular for cycling but don’t have any cycle facilities (or very constrained ones); the section of Papanui Rd through Merivale is another case in point.
Turning our attention to common cycle crash factors and, contrary to popular belief, getting hit from behind is not the biggest safety issue – most of your main problems are from traffic in front of you (e.g. 57% of crashes are “crossing/turning” movements). The top categories of factors identified (NB: can have more than one listed) are:
- “Poor observation” (55%)
- “Failed to give way or stop” (55%)
- “Incorrect lane or position” (18%)

I haven’t teased out here the relative attribution of faults to either party. We know that drivers are deemed to be fully or partly at fault in about 2/3 of all crashes, but clearly that doesn’t make the cycling party always blameless. I suspect that “poor observation” is mostly a bad habit of drivers whereas “failing to give way” may have a greater number of cyclists also guilty of this. The prevalence of “incorrect lane/position” probably correlates with many cyclists’ sense of motor vehicles passing them too closely, but it may also relate to cyclists being in the wrong place when making a particular manoeuvre.
Interestingly, trucks and buses don’t feature too highly in our cycle crashes (only ~6%), although we do know that they are often involved in some of the more serious incidents (like two fatalities in 2014). For all the purported concern about cyclists and pedestrians colliding, there are only four such crashes recorded in the database over 5 years. Most of the other statistics don’t really surprise me given the relative levels of cycling exposure in each case; e.g. 18% of crashes in dark/twilight conditions, 11% in wet weather, 64% at intersections.
While cycle crashes are a relatively small (and thankfully rare) part of our lives, they still merit some consideration of how things could be made better. Some of that might involve physical works (including the much-heralded Major Cycleways), while there may also be a need for educational or promotional initiatives as well to tackle common problems that are more widespread.
What cycle safety issues should City Council focus on?


I’d love to see the same map but for 2015-current. Wonder what has improved, and what has deteriorated.